Showing posts with label debate tournaments. Show all posts

Sunday, March 24, 2019

Scheduled elimination tournament calculator

Single-elimination tournaments have one particular flaw: The tournament can only break powers of 2--i.e., 2, 4, 8, 16, 32, etc., teams can make it into the elimination rounds, unless the tournament decides to do a partial elimination round. For example, let's say the tournament decides to break 20 teams. So, the partial elimination round will involve eight teams debating, with twelve teams sitting around and waiting for two hours. The eight teams debating turns into four teams advancing to the first full elimination round, plus the twelve teams that sat around, making for a perfect bracket of sixteen. It works, but... meh. I don't like that the majority of the elimination-qualified teams did nothing for a whole round--it's kind of unfair that they could scout, plan a new strategy, or go get a nice meal and relax. And I especially don't like it, as a tournament director, that instead of just doing one big elimination round right after preliminary rounds and being done with it, I've got to drag it out into two smaller rounds. Let me explain this one a bit.

Ideally, a tournament breaks exactly one-third of its preliminary teams into elimination rounds. This is the ideal because preliminary rounds use one judge, elimination rounds use three, and well, you get the math. Assuming I have just enough judges for prelims, then breaking one-third of teams will use up all my judges perfectly for the first elimination round. The tournament director can say to every judge, "You must stick around for at least the first elimination round. I need everyone. Then I will start to dismiss judges whose schools have been eliminated." It works out brilliantly if every judge is used in elim round 1, half are needed in elim round 2, a quarter are needed in elim round 3... Smooth and simple.

Now consider the 20 teams breaking to elimination rounds problem. That means I have about 60 teams in prelims, and therefore 30 judges. In the partial elimination round, eight teams debate, so that is four rounds... therefore I need to use twelve of my 30 judges. In the first full elimination round, sixteen teams debate, so eight rounds, meaning I need 24 of my 30 judges. Notice how awkward and weird this has become? Some judges must judge both elim rounds--whom to pick? No one can go home until the first full elimination round is through, so that requires every judge to stay an extra two hours. Many of those judges will have nothing to do for the first two hours--I don't need them for a round. They just have to wait. Is there a better way to break a number of teams that isn't a power of 2?

Double-elimination tournaments can take on any even number of teams, so the above case of 20 is no particular problem, but they run into a different problem very quickly: the double elimination rule usually produces odd numbers of teams during the tournament for some rounds. If the tournament is run with brackets, then you can see how the math works quite easily. With 20 teams to start, ten will be undefeated and ten once-defeated after round 1. After round 2, five will be undefeated, ten will be once-defeated, and five twice-defeated and eliminated. That leaves fifteen teams and the perennial problem: some team has got to get a bye in round 3. Round 3! This is less fair than a team getting a bye in the partial elimination round in the single-elimination tournament. Is there no other option?

My proposed solution is the scheduled-elimination tournament. The plan is quite simple:
  1. Do not eliminate teams that are undefeated.
  2. You must eliminate teams that are twice-defeated.
  3. Decide which once-defeated teams to keep based on speaker points or preliminary seed.
  4. Always keep an even number of teams.
  5. Undefeated teams must debate undefeated teams; once-defeated teams must debate once-defeated teams; one pull-up is allowed.* (see note below for fun substitution!)
In practice, a scheduled-elimination tournament would look quite similar to a double-elimination tournament. Any (even) number of teams could break. There's an undefeated and once-defeated bracket going on in elimination rounds, just like in a double-elimination tournament.* (not necessarily--see note below!) But in many ways, the scheduled-elimination tournament is more similar to a single-elimination tournament: losing one round makes a team eligible for elimination. The tournament could decide to keep most of the once-defeated teams around, or eliminate most of them. It's up to the tournament. A once-defeated team might stick around to win the tournament, but only if the team had high enough speaker points or preliminary seed in order to never be eliminated. This being a mathematical problem, I made a graph to illustrate.


The single-elimination option (green) and the double-elimination option (red) create a lower and upper boundary on possibilities for the scheduled-elimination tournament (anything in the gray area--and yes, I chose gray for its symbolism). So long as the tournament keeps the remaining number of teams in the gray zone, then it has abided by condition 1 and 2 that I specified above. The gray zone represents all the once-defeated teams in the tournament. If the tournament cuts closer to the green curve, it eliminates most of the once-defeated teams. If the tournament goes closer to the red curve, it keeps most of the once-defeated teams. As you can see, the red curve is flat at first--no one in a double-elimination tournament is eliminated after only one round.

You might wonder what the two marked points, (3.32, 2) and (6.16, 2), are. This represents how many rounds each type of tournament will need to have, because two teams remaining leads immediately into the final round. The single-elimination tournament needs to have 3.32 rounds, plus the championship round. About one-third of teams participate in the partial round (eight out of 20), thus the 0.32, then the first full elim round will be sixteen teams, the second round will be eight, the third round will be four, and the fourth round will be two teams--the championship round. Four rounds, plus a partial. Similarly, the double-elimination tournament will need to have 6.16 rounds, plus the championship round. That means you're looking at seven or eight total rounds, including the championship round, depending on how the byes and pull-ups go. The scheduled-elimination tournament would have more than the four plus partial (so really five) elimination rounds of the single-elim tournament but fewer than the seven elimination rounds of the double-elim tournament.

There is considerable choice in that gray zone for how to run a scheduled-elimination tournament. One option would be to run what is almost a single-elimination tournament--but with no partial elimination round to start. Here's an example:


The tournament starts with 20 teams entering: (0, 20). Ten team remain after round 1: (1, 10). (The round itself is really the line segment from (0, 20) to (1, 10): starting with 20 and ending with 10 is round 1's effect.) After round 2, there are five undefeated teams, but the tournament keeps one once-defeated team for a total of six teams: (2, 6). There could be as many as three undefeated teams after round 3, but the tournament keeps four teams on just in case: (3, 4). After round 4, only two teams remain (4, 2), and then round 5 will be the championship round between those two teams. By keeping on perhaps two teams that are once-defeated (after rounds 2 and 3), this method eliminates having the partial elimination round where twelve teams sit around pointlessly, and it has made managing the judging pool much, much more predictable. The tournament will use: 100% of its judging pool for round 1, 50% for round 2, 30% for round 3, 20% for round 4, and 10%--the final three judges--to decide the championship round.

Another option is that a tournament could basically hew as close as possible to running a double-elimination tournament, yet avoid the problem of byes, by using a scheduled-elimination tournament. Here's an example:


As you can see, this tournament eliminates no team after round 1 (all twenty remain), eliminates six teams after round 2 for fourteen remaining, eliminates four teams after round 3 for ten remaining, eliminates four after round 4 for six remaining, eliminates two after round 5 for four remaining, and eliminates two more after round 6 for two remaining. The championship round will be round 7 between the two final teams. (In practice, because of pull-ups, this could potentially violate my second condition in the list above--some twice-defeated teams might stay in. The tournament should probably not cut quite so close to the red curve if it wants to respect this condition. The sequence 20-20-12-8-4-2 might be better in this regard.)

This option lengthened the tournament by two rounds compared to the previous option, but the trade-off is that this tournament eliminated almost no once-defeated teams. In general, it's possible that a once-defeated team goes on to win a scheduled-elimination tournament (e.g., they defeat the remaining undefeated team in the final round and beat them on points) if somewhat unlikely. It's also possible that a once-defeated team survives the cut after round 3, yet even though it wins round 4, the team doesn't survive that post-round 4 cut because its speaker points aren't high enough. This outcome seems reasonable enough to me. Being eliminated based on one loss and low points seems fine to me, although I would generally want my tournaments to stay closer to the two loss and done side of the gray zone. But--it's up the tournament to decide what makes sense for their goals and available time and judges.

I think I would add one other condition to a scheduled-elimination tournament, for a total of six. Condition #6 is: "Once the tournament begins eliminating teams, never increase the number of teams cut after a round above how many were cut after the previous round." In other words, the curve of cuts should flatten out. In the example graph immediately above, the cuts go: -6, -4, -4, -2, and -2. This seems reasonable and straightforward. It seems beyond silly to have the cuts go: -6, -8, -4, -2, -4, -2. Put them in a more sensible order.

I've made the applet available for you to use here: https://ggbm.at/dx9kgnbb. You can change the number of teams, and move the number of teams remaining after each round up or down. The line segments between each round will only show if you meet my sixth condition of eliminating fewer (or the same) number of teams after each round than the previous round.

* Fun addendum: This condition can be swapped out for a different one. The teams do not need to debate within brackets--i.e., several undefeated teams could debate once-defeated teams--so long as no cut is ever more than one-half of the teams remaining (which just seems reasonable and fair). The "no-more-than-half" rule can be substituted for the bracket condition without any risk of violating the first condition to not eliminate undefeated teams. The proof of this is fairly elementary, but let's think through an example first. Say 100% of the teams still in the tournament are undefeated (because you eliminated all the once-defeated teams). After one additional round, 50% will be once-defeated. That turns out to be the worst possible case, so the "no-more-than-half" rule keeps us on the happy side of condition #1.

Let's do this more conclusively with a bit of algebra. Say x% of the teams were undefeated and y% were once-defeated (and obviously x+y=100). If x>y, then y undefeated teams might debate y once-defeated teams, leading to y% of teams remaining undefeated. The remainder of undefeated teams, x-y, will have to debate themselves. So (1/2) (x-y) will also be undefeated through that pathway. That means we have y + (1/2) (x-y) undefeated teams, which simplifies to (1/2) x + (1/2) y, or (1/2) (x+y). Since x+y=100, that means 50% will be undefeated. The worst case scenario is that as many as 50% of the teams are undefeated. Never eliminate more than half of the teams remaining after a round, and the bracket condition can be dropped. It's a huge benefit to be able to drop it! This makes many more rounds possible--so you can avoid schools debating themselves, or opponents debating each other multiple times, until the very end of the tournament. Yay!

Wednesday, December 12, 2018

Tabulation software

Hi all,

I've been thinking about how to run tournaments for many years and publishing articles on it. My published ideas have ranged from geographic mixing, logit scores, and new methods for strength-of-schedule pairing and constrained side equalization assignment.

I've finally gotten around to putting all the ideas into a single, programming-ready document. I'm putting it out there as a Creative Commons Attribution (BY) license, version 4.0. Please feel free to use any ideas contained herein, as long as you attribute me.

Friday, July 27, 2018

Random matching in debate tournaments

Every debater knows the predicted number of teams with each record when power-matching is used:


and so on. But how would it work without power-matching? What if teams were paired at random? The easy part is using the laws of probability to figure out which matches happen by chance. That's listed in column F.


The hard part is figuring out which team wins. If both teams have the same record, then whichever team wins, the outcome is the same. For example, in round two, the 25 teams in 1-0 vs. 1-0 rounds (ignore the fact that this is odd--it makes no difference in the end) and the 25 teams in 0-1 vs. 0-1 rounds guarantees that 12.5 teams will have a 2-0 record; 25 will be 1-1; and 12.5 will be 0-2. These guaranteed outcomes are listed in column I.

But what happens if the two teams have different records? One possibility is that there are no upsets at all. For example, in round two, of the 50 teams in 1-0 vs. 0-1 rounds, exactly half are 1-0s. These 25 teams might all win--no upsets--and become 2-0s. The 25 teams that are 0-1s all become 0-2s. These no-upset results are listed in column J.

The other possibility is that all rounds with mixed records have upsets. In round two, of the 50 teams with 1-0 vs. 0-1 rounds, the 25 teams that are 0-1s could all win, becoming 1-1s, while the 25 teams with 1-0s all lose, become 1-1s. Thus all 50 teams end up 1-1. These all-upset results are listed in column K.

Of course, neither no-upsets or all-upsets is realistic. From other research I've done, it turns out the upset rate is more like 20%, so I blended the two results 80:20 no-upsets:all-upsets in column L. As you can see, the ultimate outcome is that each record is nearly balanced with the others, though slightly more in the mediocre results. For example, after three rounds, a 20% upset rate results in about 17 teams that are 4-0s; 22 teams that are 3-1s; 23 teams that are 2-2s; etc.

Yet the 20% upset rate is probably conservative. It is unlikely that an 0-3 team has a 20% chance against a 3-0 team. As the teams are farther apart in record in later rounds, the overall upset rate must drop. If this is so, the final outcomes flatten. It turns out that if the upset rate is 1/6 for round two, drops to 1/8 for round three, and further drops to 1/10 for round four, then the final outcome is that exactly 20 teams are 4-0s; 20 are 3-1s; etc.


What happens if teams are paired at random? It depends on the upset rate. If it's exactly 50% (which is far too high), then the final outcomes look exactly like it would with power-matching:


If the upset rate is a more realistic, empirically justified 20%, then the outcomes are much flattened and nearly equally distributed:


Here's the sheet for anyone who'd like to play around with it.

Wednesday, May 16, 2018

Why debate tournaments have been doing side assignment wrong

Side assignment is easy, right? In odd rounds, assign teams to sides at random. In even rounds, assign each team to the opposite side as the previous round. What could be easier?

The problem is that this makes even rounds harder to pair. Any tournament director can tell you that even rounds often "lock up" and that one has to break brackets to make matches. I know I've sat at a screen, wishing the two 5-0s that are both due Aff could hit, instead of each getting a pull-up.

I stumbled on an alternative, what I call the constrained side equalization (C.S.E.) method. Instead of balancing Aff-Neg rounds at the end of even rounds, this method works its magic at the end of odd rounds. Here's the C.S.E. in action:

Rd 1 - paired at random
Rd 2 - paired at random, ignoring sides. If both teams were Aff in round 1, or both Neg in round 1, it's a computer flip-for-sides. If one team was Aff and the other was Neg, then the sides are equalized.

At the end of round 2, about 25% of teams will have two Affs, 25% two Negs, and 50% will be balanced. (It depends on the random pairings.)

Rd 3 - Teams with two Affs must go Neg; teams with Negs must go Aff. The balanced teams are not assigned to either side. If a balanced team is matched against a two-Aff team, then the two-Aff team goes Neg. Likewise, if a balanced team is matched against a two-Neg team, then the two-Neg team goes Aff. If a two-Aff team is matched against a two-Neg team, then the sides are equalized. And if a balanced team is matched against a balanced team, then it's a computer flip-for-sides.

At the end of round 3, every team will either have had two Affs and one Neg, or two Negs and one Aff. In other words, at the end of an odd round, the sides are "equalized."

The cycle repeats. Round 4 is paired at random, ignoring sides. Round 5 has the constraint that teams with three Affs must go Neg and teams with three Negs must go Aff; otherwise, any team can be paired against any other. If the tournament ends on an odd round, there's no special other consideration. If the tournament ends on an even round, you'd want to pair teams in the typical way for the final prelim.

Mathematically, it is as simple as this rule:
If the Aff rounds - Neg rounds is 2 or -2, then the team is assigned a side first, then paired with an opponent; otherwise, a team is assigned an opponent first, then assigned a side (to equalize if necessary).
This works in odd or even rounds.

But why go to all this bother? The reason is simple: constraints.

 OddEven Avg. 
 Trad. 100%50% 75% 
Alt.  87.5%100% 94% 

In a traditional method, in odd rounds, 100% of possible matches-- 0.5 * (n (n - 1)) --could be considered. There are no side constraints in odd rounds, so anyone could be matched against anyone. But in an even round, a tournament is limited to a fourth of (n (n - 1)). A due-Aff team can only be matched against a due-Neg team. This is a huge constraint.

Using the C.S.E. method, in odd rounds, teams with more Affs must go Neg and vice versa. Aside from this small constraint (only about one-eighth of possible matches ruled out), nearly anyone can debate anyone. And in even rounds, it's 100% of possible matches that can be considered. The C.S.E. method has much lower overall constraints than the traditional method.

In other words, the odd C.S.E. round is considerably easier to pair than the even traditional round (21 times better odds of finding a good pairing, in fact). If a side assignment for C.S.E. happens to not turn up a suitable pairing, why, you can reshuffle the teams--switching some randomly selected teams' side, excepting the couple side-constrained teams--and try again. This works whether it's an odd or an even round. In the traditional method, you can only reshuffle with an odd round. You're stuck with the even round side assignments you get with the traditional method. This inability to reshuffle the teams means the tournament can lock up. In the C.S.E. method, because any round can be reshuffled, there's always another chance to find a good pairing.

I worked out an example here. At the end of five rounds of C.S.E., every team had either two or three Affs. The method yielded side "equivalence."

But, intriguingly, the teams took different paths to get there. Some went Aff two times in a row. Some alternated. Although all the paths end with one of two correct results--two or three Affs--there were more path types to get there and thus more options to pair the teams. More paths = more flexibility. We've been doing side assignment the hard way!

Saturday, February 11, 2017

The Logit Score: a new way to rate debate teams

I recently published an article on a new debate team-rating method I invented, called the logit score. I hope the logit score will take its place among win-loss record, average speaker points, median speaker points, opponent wins, ranks, and so on as an effective way to rate (and thus rank) debate teams at a tournament.

What is the logit score?


The basic idea is simple: the logit score combines win-loss record, speaker points, and opponent strength into one score using a probability model. In other words, the logit score is the answer to the question, "Given these speaker points and these wins and losses to those particular opponents, what is the likeliest strength of this team?"

Let's take a step back and acknowledge a truth not universally acknowledged in debate: results should be thought of as probabilities, not certainties. A good team won't always beat a bad team--just usually. Off days, unusual arguments, mistakes, and odd judging decisions all contribute to a slight risk of the bad team winning. The truly better team won't always prevail. That means actual rounds need to be thought of as suggesting but not definitively proving which team is better. Team A beats team B. Team A is probably better, but then again, they could have had off day, been surprised by a weird argument, or had a terrible judge. If team A got much, much higher speaker points, it was very likely the better team. If team A only edged out team B by a little bit, then the uncertainty grows.

That's where the logit score comes in. Estimating team A's actual, true strength depends on putting together all of those probabilities and uncertainties into one model. I won't get into the specifics (the details are in the article), but the basic idea is using a logistic regression to put the probabilities for wins and losses to specific opponents as well as specific speaker points received together. The logit score for a team means: "If team A were estimated to be stronger, these results would be a bit more likely, but those other results would be far less likely. If team A were estimated to be weaker, these results would be far less likely, even though those other results would be a bit more likely. This logit score is the proper balance that makes all the results most likely overall." Because it factors in all the results in one probability model, the logit score isn't sensitive to outliers: unusually high or low speaker points, losses to outstanding teams, and wins over terrible teams don't affect the logit score much at all.

Does the logit score have any empirical results to back it up?


Yes. This is the bulk of my article.

I took a past college debate season, used those results to give every team a logit score, and then looked to see how well logit scores "retrodicted" the actual results in a season. That is to say, how often did the higher logit scoring team win rounds against the lower logit scoring team? As a baseline of comparison, I also did the same kind of analysis by ranking the teams by win-loss record.

The logit score rankings got slightly more rounds correct than the win-loss record rankings.

The slightly higher accuracy is not, on its own, a reason to rush to adopt logit scores. It merely proves that the logit scores aren't doing anything crazy. For the most part, the logit scores reshuffles teams ever so slightly with their nearest peers. The moves are slight ups or downs, not drastic shifts.

The real reason to consider using logit scores is that (a) they are less sensitive to outliers, which can matter a lot for a six or eight round tournament; and (b) they factor in more information. Win-loss records only use speaker points as a tiebreaker; it's secondary. Measures of opponent strength usually come third. In other words, a team with a really tough random draw and goes 4-2 as a result of dropping the first two rounds might miss out on breaking if no 4-2s break--win-loss record comes first and opponent strength won't factor in in that scenario. The logit score on the other hand--because wins, points, and opponents are all factored in at once--could reflect that this team is in fact very strong because it only lost two rounds to very good opponents. (See how important it is to be less sensitive to outliers?) More information also rewards well-rounded teams: those that win rounds on squeakingly close decisions and don't receive great speaker points are penalized more under a logit score system than a win-loss-then speaker points-system.

Saturday, July 4, 2015

Study of speaker points and power-matching for 2006-7

For my 100th blog post, I did an experiment to try different tabulation methods for debate tournaments. The benefit of an experiment is that the exact strength of each team is known and the simulated tournaments introduced random deviation on performance in each round. The deviation in performance is based on observed results.

The results of the experiment showed that, even after only six rounds, median speaker points is a more accurate measure of a team's true strength than its win-loss record. Furthermore, the results showed that high-low power-matching improved the accuracy of the win-loss record as a measure of strength (but only to the same level of accuracy as median speaker points) and high-high power-matching worsened its accuracy.

Description of the study


This experiment lead me to do an observational study of the 2006-07 college cross-examination debate season. I analyzed all the varsity, preliminary rounds listed on debateresults.com: 7,923 rounds; 730 teams. This was the last year when every tournament used the traditional 30-point speaker point scale. Each team was assigned a speaker point rank from 1 (best) to 730 based on its average speaker points. Each team was also assigned a win-loss record rank from 1 to 730 based on the binomial probability of achieving its particular number of wins and losses by chance. Thus, both teams that had extensive, mediocre records AND teams with few total rounds ended up in the middle of the win ranks.

Next, I analyzed every individual round using the two opponents' point ranks and win ranks. For example, if one team had a good point rank and one a bad point rank, then of course the odds are quite high the good team would win. On the other hand, if the two teams were similarly ranked, then the odds are much closer to even. Using the point ranks, I did a logit regression to model the odds for different match-ups. And I also ran a separate logit regression for win ranks. Here are the regressions:


The horizontal axis shows the difference in the ranks between the two opponents. The vertical axis shows the probability of the Affirmative winning. For example, when Affirmative teams were 400 ranks better (smaller number) than its opponent, they won about 90% of those rounds. These odds are based on the actual outcomes observed in the 2006-07 college debate season.

The belief in the debate community is that speaker points were too subjective -- in the very next season, the format of speaker points was tinkered with and changed. The community settled on adjusting speaker points for judge variability, that is using "second order z-scores." Yet my analysis shows that, over the entire season, the average speaker points of a team is a remarkably good measure of its true strength. Making a lot of adjustments to the speaker points is unnecessary.

First, note how similar the two logistic regressions are. A difference of 100 win ranks, say, is as meaningful for predicting the actual outcomes as a difference of 100 point ranks. Using the point ranks regression "predicts" 75% of rounds correctly, while using the win ranks regression "predicts" 76% correctly. Both regressions "predict" each team's win-loss record with 91% accuracy. (This discrepancy between 75% and 91% occurs because, overall, many rounds are close and therefore difficult to predict -- but for an individual team that has eight close rounds, predicting a 4-4 record is likely to be very accurate.)

What is impressive to me is that, even without correcting for judge bias, the two methods are very comparable. Bear in mind it is NOT because every team receives identical win ranks and point ranks. In fact, as you will see in the next section, some teams got quite different ranks from points and from wins!

Power-matching


In the second part of my analysis, I looked at how power-matching influenced the results. I could not separate out how each round was power-matched because that information was not available through debateresults.com. But college debate rounds tend to be power-matched high-low, which is better than power-matching high-high (as my experiment showed). I eliminated teams with fewer than 12 rounds because they have such erratic results. This left 390 teams for the second analysis.

The goal of power-matching is to give good teams harder schedules and bad teams weaker schedules. Does it succeed at this goal?

No:


I made pairwise comparisons between the best and second-best team, the second- and third-best team, and so on. It is common for two teams with nearly identical ranks to have very different schedules. The average difference in schedule strength is 68 ranks apart out of only 730 ranks, which is almost a tenth of the field! One team may face a schedule strength at the 50th percentile, while a nearly identical team faces a schedule strength at the 60th percentile. Bear in mind that this is the average; in some cases, two nearly identical teams faced schedule strengths 30 percentiles apart! I cannot think of clearer evidence that power-matching fails at its assigned goal.

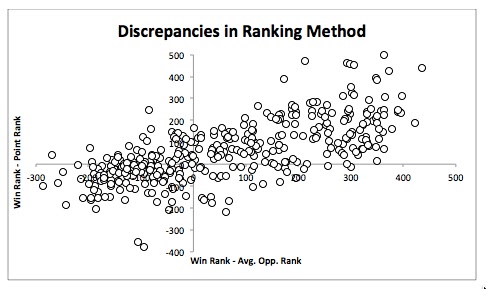
Finally, I performed a regression to see whether these differing schedule strengths is the cause of the discrepancy between win ranks and point ranks.

Yes:


The horizontal axis shows the difference between each team's rank and its schedule strength. The zero represents teams that have ranks equal to schedule strength. The vertical axis shows the difference between each team's win rank and point rank.

Teams in the upper right corner had easier schedules than they should have (under power-matched) and better win ranks than point ranks. Teams in the lower right corner had harder schedules than they should have (over power-matched) and had worse win ranks than point ranks. Having easy schedules improved win ranks; having hard schedules worsened win ranks. The effect is substantial: r^2 is 0.49. Of course, some of the discrepancy between the ranks is caused by other factors: random judging, teams that speak poorly but make good arguments, etc. But power-matching itself is the largest source of the discrepancy.

Given that the schedule strengths varied so much, this is a big, big problem. I know that tab methods have improved since 2006-7 and now factor in schedule strength; this analysis should be rerun on the current data set to see if the problem has been repaired.

Conclusions


  1. Speaker points are just as accurate a measure of true team strength as win-loss record. This confirms the results of my experiment showing that power-matched win-loss record is at rough parity in accuracy to median speaker points.
  2. Power-matching as practiced in the 2006-07 college debate season does not give equal strength teams equal schedules. (This method is probably still in use in many high school tournaments.)
  3. Unequal schedule strengths are highly correlated with discrepancies in the two ranking methods, point ranks and win ranks.


One could argue for power-matching on educational grounds: it makes the tournament more educational for the competitors. However, it is clear from this analysis that power-matching is not necessary to figure out who the best teams are. In fact, it might actually be counterproductive. Using power-matched win-loss records takes out one source of variability from the ranking method -- judges who give inaccurate speaker points -- but adds an entirely new one: highly differing schedule strength!

Sunday, January 4, 2015

100th Post!!

My hundredth post! When I started 5 and a half years ago, I never imagined I would get here. It turns out that I have written a post, on average, every 20 days. I thought for this special occasion, I would go back to one of my original reasons for starting this blog: my dislike for the traditional methods of power matching in debate tournaments. My opinion was -- and still is -- that power matching doesn't give each debate team a fair experience at the tournament. Many debate teams make it to elimination rounds without facing good opponents. My solution was to create a strength-of-schedule pairing that power-matched but also attempted to even out schedule strength. That was five years ago. Since that time, I have come to believe that it's better to abandon power matching rather than try to improve it. The alternative is random prelims. Random prelims works for the N.S.D.A. Nationals (formerly the N.F.L.) and can even be improved with geographic mixing.

I decided to test it out with an experiment. How do different pairing methods compare at producing the actual ranking of the teams? Obviously, one only has actual rankings in an experiment. To start, I generated 200 random teams, giving each one a true strength. The true strengths were in a Normal distribution with an average of 27 points and standard deviation of 1 point. This is realistic, based on previous empirical analysis I've done. Next, I paired the teams against each other using one of four pairing methods. Each team's performance could deviate from its true strength by a random number that followed a Normal distribution, average of 0, standard deviation of 1 point. In other words, most teams would perform within +/- 1 point of their true strength about 68% of the time. This may seem like a lot but is realistic from the same empirical analysis. This deviation in performance accounts for off-rounds, surprise strategies, and judging variability (e.g., point trolls), too.

Based on the two team's strengths and factoring in their random deviations from their true strengths, I decreed a winner. Then I set up the next round using the stated pairing method. After all six rounds, I calculated each team's win/loss record, total speaker points, and median speaker points (more on this in a moment). I ran the same tournament four times, one for each pairing method: (1) simple random, (2) random within win/loss bracket, (3) high-high power matched, and (4) high-low power matched. I used the same round 1 pairing for all four methods to give them all even starting conditions. For each one of the methods, I used the results at the end to calculate a traditional ranking (win/loss, then total speaker points, then median speaker points) from 1 to 200 and also a "median points" ranking (first, median speaker points, then total speaker points, then win/loss record) from 1 to 200 -- and compared them to the true rankings. The results kind of blew my mind and switched my perspective around.

A few caveats for the nit-pickers: yes, I ignored low-point wins. Those aren't too frequent and, as you will see, including them would only make my case stronger. And yes, I ignored side constraints and I pretended like the teams were from 200 different schools. Again, using those constraints would only strengthen my case. Without further ado, here are the results:


This is the r-squared, the coefficient of determination you might have learned about in Intro to Stats, of the traditional and median points rankings to the actual ranking for each pairing method I tested out. A high r-squared is good; it means the listed ranking closely corresponds to the truth.

A couple of things to draw your attention to:  (a) the median points rankings do not change much for any pairing method; (b) the median points rankings are higher than or almost equal to the traditional rankings for every pairing method; and (c) the traditional rankings are closest to true rankings for the high-low pairing, then the random within brackets pairing, then the simple random pairing, and lastly the high-high pairings.

It is actually worth looking at that last one:


Notice the clear pattern? In a high-high pairing, a ton of decent teams get screwed by getting several very hard opponents and therefore have terrible records -- these are the outliers that are very low on the y-axis (indicating true strength) but on the right side of the x-axis (indicating very poor records). Notice the one team in the far bottom right: pity the poor team that had true ranking of 19 but ended up with a 1-5 record and ranked 183rd by the traditional tiebreakers. Enragingly, a lot of weak teams somehow squeak by to great records. Notice the one team in the upper left: 148th in truth, but given several easy opponents, ending up 5-1 and ranked 21st by the traditional tiebreakers. Visually, you can see how unjust the whole high-high pairing is when coupled with using win/loss record as the primary criterion for ranking, as it is in the traditional method. The median points ranking does not suffer from the same problem; even the good team that gets several tough opponents and ends up 1-5 is not penalized in the rankings, as long as that team continued to earn high points in each one of its rounds.

For comparison, here is what the best correlation looked like:


To be sure, the correlation is far from perfect. But that's just about variability in the teams' in-round performances compared to their true strengths (that random deviation score I added). In other words, what you are looking at is just the off-days, surprises, and crappy judging that is unavoidable. It isn't really possible to do better than about 0.82 or 0.83 -- that's why the median rankings have about the same correlation, no matter what the pairing method.

On the other hand, the traditional rankings are very sensitive to the pairing method. Why? A team's record depends on both its true strength and the opponents it faces! In the high-high pairing method, many teams get unfairly hard or unfairly easy opponents. The method drives down the correlation between true strength and record by screwing some and blessing others. However, in the high-low pairing method, the assignment of opponents pushes up the correlation between true strength and record -- better teams face weaker opponents, so get a few more easy wins.

It can be a bit hard to interpret what these correlations means, so I also calculated the mean absolute deviations for each pairing method and ranking. For each team, I took its traditional rank and its true rank, found the difference, and took the absolute value. Then I averaged those to produce the mean absolute deviation (MAD). I also did the same thing for the median points rankings.


For example, for the random within bracket pairing method, the median points ranking had a MAD of 18.66. That means, on average, the median ranking was off by 18.66 places from the truth. The lower the MAD, the better.

The exact same patterns appear as in the correlations table. In general, the best we can hope for is to be within about 20 places of the truth. Given that debaters have off-rounds, and that our sample size is only six rounds, this isn't terrible: 20/200 is 10%. The true ranking is probably +/- decile from the median points ranking. Notice that the traditional rankings are sensitive to the pairing method in the exact same pattern. If one uses the traditional criteria for ranking, then the high-low pairing is best. So, was I wrong five years ago?

In both of the two tables I've given so far, the high-low pairing method plus traditional ranking was marginally superior to any pairing method plus median points ranking. But the problem is that it is not equally important to rank any team correctly. It is more important to get the top teams right. Enter the weighted rule. As I did for the MAD, I took each team's traditional rank, subtracted its true rank, and took the absolute value. But before I averaged, I divided by the team's true rank. Thus, getting a good team's results wrong by a lot was worth big negative points; getting a weak team's results by a lot was worth a few negative points. The results:


The pattern is almost the same as before, except that... high-low pairings and traditional rankings is worse (higher score) than random pairings with median rankings. This means that the high-low plus traditional combination made more mistakes ranking the best teams than the random plus median combination.

What are the take-aways?


1. If you are doing high-high power matching, STOP IT RIGHT NOW. Even one round of high-high power matching is harmful. You are screwing many teams over.


2. Consider using the median points ranking instead of the traditional ranking.

On T.R.P.C., it means putting the "drop two high - drop two low speaker points" as the first criterion for ranking. (For a three- or four-round tournament, the "drop high - drop low" option is equivalent to the median. For a five- or six-round tournament, the double-drop option is equivalent to the median. For a seven- or eight-round tournament, the triple-drop option is equivalent to the median.) You can make win/loss record the second or third criterion.

All the data from my experiment show that the median ranking is simply more accurate, no matter how you pair the tournament. The win/loss record is too variable.


3. Consider not doing high-low power matching either.

It is enormously time intensive to run a power-matched tournament. In some cases, power-matching adds 2-3 hours for a six-round tournament: 30-45 minutes after rounds 2, 3, 4, and 5 -- although one or two or those lag times might occur during a food break that had to happen anyway. But 2-3 hours might be used in other ways... say, to squeeze in an extra round. Another round would, in fact, yield more data and would improve the accuracy of the results far more than stopping frequently to power match. And, as the experiment data show, high-low pairings do not improve the accuracy any more than simply switching over to median rankings. (Furthermore, I suspect that high-low pairings plus traditional rankings' accuracy peaks at around five to six preliminary rounds; my suspicion is that for longer tournaments, the accuracy starts to go down again because the brackets start to get too small.)

High-low power matching does have something to argue for it: teams get to see more opponents of similar ability levels (to themselves). But there's a counterargument: random pairings enable teams to see a wide cross-section of opponents' skill levels, and better gauge where they fall on the spectrum. Getting your butt kicked can inspire striving, and besides, your tournament should have a novice and JV division for teams that are afraid of the best opponents in the top division.

However, if you feel like high-low power matching is something you want to preserve but you do want to speed up your tournament, then go to lag-powering. For example, round 3 would be power matched, but only off of the results of round 1. You can slip round 3 pairings under the doors while round 2 is wrapping up, cutting your turnaround time drastically. You probably won't push down your accuracy too much (see how well random within brackets plus traditional rankings compares) if you lag-power -- but especially not if you use median points rankings.


4. Do everything you can to help your judges give speaker points more consistently.

If speaker points are more accurate than records, that means we ought to put more weight on speaker points AND strive to make them seem less arbitrary. Brief training sessions at the beginning of the tournament for less experienced judges, clearly delineated rubrics for speaker points, or scoring grids for various attributes of speaking all help!


A changed perspective


I used to think that power matching started as the best way people had, when tabbing on notecards, to improve the accuracy of tournament results. Maybe that is why it got started, but as we can see, all it does is bring accuracy to parity with median rankings. Is there any other reason tabbers might have started to use power matching?

Then it dawned on me: power matching reduces the likelihood that two teams have met before will be randomly drawn against each other in later rounds. Team A might meet team B in round 1, win, then lose round 2. Team B might do the opposite and win round 2, giving the two opponents a possibility of being randomly drawn against each other for round 3 -- but overall, power matching makes it less likely than simply randomly assigning everyone in one big pool. When you're tabbing on notecards, it speeds things up considerably if this is a rare occurrence. Maybe power matching began, not with HH or HL but with the random within brackets pairing. In other words, how we pair double elimination tournaments (undefeateds and down-ones in two separate brackets, randomly assigned in each) might have gotten translated to all preliminary rounds at all tournaments.

Just a suspicion. It does make sense: high-low (or the awful high-high) brackets are hard to do on notecards, but random within brackets is easy to do.

Monday, June 9, 2014

Resolving ties in a round-robin tournament

Let's consider a round-robin tournament. Arrows point to the loser in each match.


A is 4-1; B, C, and D are 3-2; E is 2-3, and F is 0-5. How to break the three-way tie for second place? Most round-robin tournaments would use total speaker points, but I think this is unnecessary. (And all sorts of weird things can happen if you use total points to decide tournaments.)

There are four different methods I would like to consider. The first is a method of my own invention, weighted wins and weighted losses. While this method is very simple and easy to use, it is better for incomplete tournaments (regular tournaments) than it is for a complete tournament (a round robin). One key bias to note is that the method will prefer multiple smaller upsets than one big upset. In the running example, the weighted wins will rank the teams {A, B, C-D tie, E, F}. This means C's win over A, D's win over B, and E's win over D are all ties.

The second method and third methods both require using the point differentials to order the teams. I invented the following differentials in speaker points:


The second method is the ranked pairs method. The wins are ranked in order of margin, in this case, speaker point differentials. (Let's say the speaker points are adjusted by each judge's typical points. For example, a differential of 4 speaker points might be nudged up to 4.1 if 4 is actually quite a large point differential for that judge. Low point wins could be entered as zeros or a small positive number, and they should not be entered as negative numbers.)

This means the wins go A over F, A - E, B - F, D - F, D - C, C - E, A - D, C - F, B - C, B - E, A - B, D - B, E - F, C - A, and E - D. One applies the wins in order. Wins that create a contradiction (a cycle) are ignored. For example, the first win, A over F, is applied first:

{A, F} {B, C, D, E unranked}

Then next A over E:

{A, E-F tie} {B, C, D unranked}

And so on. In this particular tournament, one does not reach a contradiction until the last two wins, so one ignores C over A (A beat B, B beat C, so acknowledging C beat A would create a cycle). Same thing for E over D. Without these two results, A has 4 wins and 0 losses, B has 3 wins and 2 losses, C has 2 wins and 2 losses, D has 3 wins and 1 loss, E has 2 wins and 3 losses, and F has 0 wins and 5 losses. This sets up the ranking: {A, D, B, C, E, F}.

The third method is the Schulze method. The key idea is to look at the strongest path from each team to each opponent. The path may go through intermediaries, but it has to follow the directions of wins. For example, if a team is undefeated, no opponent would have any path back to that team, so all entries to the undefeated team would be scored zero. The strongest path is scored by its weakest link. In our running example, every path to A would go through C, so the paths would all have a strength of 1.1, for the weakest link, C over A.

Here is the path strength matrix, with the strongest of each pair (e.g., A over B vs. B over A) highlighted:


As you can see, A emerges the overall winner. The path from A to C is stronger than the path from C to A, even though the latter was an actual win, whereas the former is a pathway through D. The final ranking with the Schulze method would be {A, D, B, C, E, F} again.

The final method I would like to look at is a modified version of the Kemeny-Young method. First, one would generate a list of every possible ranking consistent with the results. Since the original tournament generated a three-way tie between B, C, and D, the possible rankings are:

{A, B, C, D, E, F}
{A, B, D, C, E, F}
{A, C, B, D, E, F}
{A, C, D, B, E, F}
{A, D, B, C, E, F}
{A, D, C, B, E, F}

Then, each ranking is scored, and the highest score ranking is preferred. (Earlier, I looked at minimizing upsets, but the effect is exactly the same.) The highest score ranking is 13:


Two results are "upsets": C over A and E over D. But this ranking is consistent with all the other results, thus earning the highest score.

To avoid ties, one could modify the wins by including decimal values for point differentials and judge variance. For example, A's win over D could be given a score of 1.028 (the 0.028 for the point differential in that win), whereas A's win over F could be given a score of 1.05. Adding tiny decimal values will not change how many upsets there are in the final, highest scored ranking -- the tiny decimals would never be worth enough points to offset an additional upset. All that the decimal values would do is allow one to chose between two otherwise tied rankings, i.e., two rankings with equal numbers of upsets.

Ranked pairs, Schulze, and Kemeny-Young all agree on the best ranking in my example: {A, D, B, C, E, F}. They do not have to, but they do. My weighted wins method disagrees, but I see this as a weakness of my method when applied to a round-robin tournament.

Conceptually, Kemeny-Young is the easiest method of all. It looks for the ranking that is most consistent with the actual wins and losses, and then if we want, at point differentials as a tie-breaker. It is an easy method to code. It would be easy to use this method for multiple-ballot rounds. My recommendation would be to use Kemeny-Young to break round-robin ties, not total speaker points or total judge variance.

Thursday, June 13, 2013

Tab program formulas (not code, but good stuff)

I will not be coaching debate next year, or for the next couple years. I have written a lot about tournament tabulation: here is the meta-post. Of course, all this thinking has led me to experiment with ways to implement these ideas into a real, working program. I am not a coder, so I have only tested out formulas, but they definitely achieve my desired results.

If you are a coder and would like to use these formulas to develop a new kind of tab program, please feel free to do so. My only request is that you credit me for any ideas you use.


Friday, July 13, 2012

Meta-debate tournament tabulation post

I have been at this blog for three and a half years. I have discussed neat calculus, geometry, and statistics problems; I have laid out some discussions for a critical thinking course; but in about half the posts, I have discussed tournament tabulation procedures. I have been working through a lot of ideas as I try to make a case for building a new generation of programs.

I just received a new book today, Who's #1? The Science of Rating and Ranking, by Langville and Meyer, two math professors. They state that they were frustrated that the methods they discuss in their book were not collected in any one other single book. I can say I share that frustration. At an initial look through it, the book is amazing. A lot of the methods they discuss I have looked at in one form or another in considering a tab program; many I have not. It is both validating and humbling. I have a lot of work to do! So, for quite a while, I am going silent on tab programs while I read this book. I will still post on neat mathematics problems and critical thinking course discussion ideas.

Before I go temporarily silent on the tab program topic, though, I thought it would be good to summarize what I have written so far. My positions have evolved in three and a half years considerably.

I started out looking at whether high-low and high-high pairings created fair schedules for teams, specifically looking at opponent wins. I looked at the Harvard tournament, a set of big national tournaments, and what was possible in theory. In general, I think the case is pretty clear that even at big tournaments, where constraints should not be an issue, the traditional methods fail to deliver fair schedules -- even within a bracket. Teams break with easy schedules; teams don't break with hard schedules.

I looked for a way to pair within brackets that I felt was more fair. The idea I hit on was strength-of-schedule pairings: a team would get an opponent that would balance out its schedule difficulty compared to other teams in the same bracket. This is a method only a computer can do, since it requires simultaneously evaluating whether team A is a good opponent for team B (as defined above) AND whether team B is a good opponent for team A. Keeping track of both ratchets up the complexity beyond a human's hands. It is still an understandable method, just too many calculations for a person to do. I tried it on a small tournament and a large tournament and found that it does indeed work to even out the schedules.

That problem "solved," I started thinking about evaluating a team's strength (and therefore also a team's schedule strength) in a more sophisticated ways than just wins and losses. I looked at graph theory, but for all its promise for some tiebreakers in round robins, it is not a good method for regular tournaments. I looked at one weighted wins scheme, where the points per win decline for each subsequent round, but this system is not good. I next looked at a weighted wins scheme where a team receives extra "points" for its defeated opponents' wins and loses points for its defeating opponents' losses. This does seem to work well for a simple method, and it lead me to think about more complex ways of getting, from the data, a team's strength on the affirmative and strength on the negative. I have also been thinking about how reliable even the best methods are. How many "upsets" are there in debate?

Along the way, I have also thought about side assignment here. I have written about how many teams will break here, here, and here. And I have sparred with A Numbers Game on whether there is topic side bias (sorry, it looks to me like novices muck up the average; varsity debaters get closer to parity) or judge side bias (again, sorry, it looks alright to me).

So where have I landed? I started out thinking all I wanted to do was propose a different within brackets pairing algorithm, which then expanded to thinking about measuring a team's strength and opponent strength. But a very early post on round robins planted the seed: preliminary rounds don't have to be elim rounds. They don't need winners and losers brackets. Teams need to meet all their opponents, or failing that, a good cross-section. So the fairest statement of what I believe now is that tournaments should ditch the brackets and start making sure that teams get mixed up by skill level and geography in prelims; let a sophisticated algorithm do the mixing, not random chance; let the best teams break, and use elims like they always have been: to pick the champion. And I think N.F.L. Nationals ought to start.

Tuesday, July 3, 2012

Probability of upsets

A team has an average strength or skill level, which is how well we expect it to debate in a typical round. This is the same as the team's tournament-long average strength (teams probably improve during the course of the entire season). But a team's strength is also variable: in any given round, it might debate better or worse than its average. This variability should follow a normal distribution. When two teams debate, either might debate above or below its average. How to model this?


The horizontal axis shows possible performances of team 1, based on a normal distribution centered at 0 (indicating an exactly average performance for team 1 based on its average strength). The vertical axis shows possible performances of team 2, again a normal distribution around 0, the average-strength performance.

Let's say that team 1 is significantly stronger than team 2. In order for team 2 to win, it must have a much better than average performance -- and team 1 would have to have a much worse than average performance. In other words, only some of the possible results in quadrant 2 would result in a team 2 win, like so:


The red cases highlight the upsets. Rare indeed, because team 1 must underperform and team 2 must overperform. As an alternative, consider the scenario that team 1 and team 2 are evenly matched. In this world, team 2 wins about 50% of the time:


Mathematically, it is simple to model this with a logistic function. If difference = team 1 strength - team 2 strength, then the formula for the probability of team 1 winning is


where k depends on the units in which strength is measured and just how variable the teams' performances are. The value of k is an empirical research question that could change from season to season. The logistic function looks like this:


As the difference gets larger, team 1 is stronger and more likely to win, approaching 100%. As the difference turns negative, team 1 is weaker and less likely to win, approaching 0%. And at a difference of 0, the teams are even, and the odds are 50-50.

I analyzed the 2010-2011 season for open/varsity policy debate for CEDA/NDT data. I looked at each team's strength, using the easy-to-understand measure of weighted wins, expressed as an expected win percentage for a season (so, 62% means that a team is expected to win 62% of its rounds in an entire season, adjusted slightly from its actual win percentage by schedule strength). Then I analyzed all the rounds that happened, based on the difference in the two teams' strengths, as either wins (for the higher rated team) or upsets (for the lower rated team).

I found that about 20% of rounds were upsets. This is close to football's 25% or so. But of course, most of the upsets occur when the teams are fairly close in rating. Here are the results:


So, for example, when the difference in the ratings was greater than 0.5 but less than 0.55, the higher rated team won 97.3% of the time. This is obviously a significant difference in the teams' strengths: a team rated at 82% weighted wins versus a team weighted at 30% weighted wins! It is hardly surprising that this is such a lock. At the other extreme, when the difference in the ratings is greater than 0.1 but less than 0.15, the higher rated team only wins about 59% of the time. These are close rounds, nearly toss-ups. A difference of 0.2 seems to be the tipping point: above this, there are few upsets.

Here is the same data in graph form:


A line of best fit is modeled. Using the formula above, my best guess is that k is about 6.5.

Friday, April 13, 2012

Weighted wins 2

I've been interested in using weighted wins as a statistic for a while. The idea is that by considering the strength of an opponent, an algorithm could handicap the results: a win against a good opponent counts for more than a win against a middling opponent. Of course, the algorithm has to base the calculation of how good an opponent is on how well it did against its opponents, so the algorithm must be based on the whole set of results. Therefore, I looked at a debate tournament and an N.F.L. season. The process can continue infinitely, although usually, after a couple times, things settle down and the handicapping doesn't change much upon further iterations. This is a kind of Markov chain technique.

One assumption that this depends on is that a team has an invariant strength. Clearly, this is suspect for debate (differing strengths on the affirmative and negative sides) and the other N.F.L. (the defense and offense are, literally, two different teams). Is it possible to use the same idea but adapt it to recognize the split-strengths?

I input total offensive yards from each 2011 N.F.L. game. A lot of yards against a weak defense is good; a lot of yards against a strong offense is better. By using only this information -- offensive yards for each team vs. each opponent -- a few matrix operations yielded a weighted offensive yards statistic and a defensive strength score for each team's offense and defense, respectively:


For example, against the "average" defense, the Saints would have earned 460 yards. The Steelers defense would have cut that to 82%, to 377 yards. Or so say these statistics. They never actually played.

How well did these statistics work? Well, as predictions, terribly. But, compared to reputable sports statisticians, fairly well. This is a comparison of my rank versus football outsiders rank (before the playoffs began) [offense on left, defense on right]:


On offensive, the difference was on average 3 ranks. On defense, the difference was on average 5.3 ranks. So, the rankings I generated from nothing other than actual yards in regular season games compared moderately closely to the ranks based on a complex calculation they call the DVOA (Defense-adjusted Value Over Average).

The same idea would work for debate tournaments: affirmative strength and negative strength could be treated as two separate variables for each team.

Monday, March 21, 2011

Bracketology

Nate Silver, who does the New York Times blog fivethirtyeight (usually on elections, but now on more), did an analysis and reports that the elimination bracket style used by the N.C.A.A. (and debate tournaments) isn't exactly fair:

http://fivethirtyeight.blogs.nytimes.com/2011/03/15/when-15th-is-better-than-8th-the-math-shows-the-bracket-is-backward/

Specifically, it makes me wonder why they don't go to the style used by the N.H.L.: amongst whichever teams are left, top seed plays bottom seed, second seed plays second worst, etc. In the N.C.A.A., fixed brackets style, if the bottom seed upsets the top seed, suddenly the bottom seed now has an easier schedule than it deserves. In the N.H.L., re-seeding style, the bottom seed would have to keep upsetting all the top seeds to keep going.

Thursday, February 3, 2011

Lock-in 1

I thought the writer Neal Stephenson did an excellent job of explaining the phenomenon of lock-in with regards to rocket technology in this article: http://www.slate.com/id/2283469/pagenum/all. It is an excellent reminder that the technologies we have are often the result of contingent (historical) factors rather than rational ones.

There's another great example here, by Alexis Madrigal. Apparently, the U.S. Navy ended up deciding that light-water reactors would be THE model for nuclear power. Another one about electric cars and electric refrigerators. And one more about, of all things, pants.

Here are two examples of lock-in that are near and dear to my heart -- that is, they drive me crazy:

1. Have you ever wondered why the U.S. math curriculum goes Algebra 1, Geometry, Algebra 2? It's a completely irrational system that no sane person would design. Algebra 2 classes start off with an extensive review of algebra since it's been 15 months since the students last saw algebra. In fact, the review can last nearly a quarter of the year. Perhaps the review period would last only a few weeks if the students were to go directly from Algebra 1 to Algebra 2. What's worse, many students aren't really developmentally ready for Algebra 1 when they take it; many need a more robust pre-algebra course. A more rational sequence would be Geometry/Pre-Algebra, Algebra 1, Algebra 2. Geometry is developmentally appropriate in 8th grade and serves as a perfect medium for pre-algebra concepts: that x stands for something that is unknown but fixed, and that one can use geometric properties to deduce x, makes sense in a geometric context. One can even get at the idea of x as a variable with similarity and ratios. And yet, year after year, school district after school district decides to keep the irrational sequence unchanged.

Why? At around the turn of the last century, when high schools were the new thing, students took Algebra and Geometry. Period. Geometry, with its logical proofs, was deemed material for seniors. As time went on, more classes were added on, always at the end. First, Algebra 2/Trigonometry was added. Then, Pre-Calculus was the senior math class. Now it's Calculus -- and thus, Algebra 1 got pushed down to 8th grade.

2. You know I'm going to talk about debate tab. I have never tabbed a tournament on notecards, but I know exactly how to do it because I've used the current generation of debate tab programs. The programs are electronic notecards. Don't get me wrong -- I'm very glad that we have the programs! They automate the mindless tasks and don't make careless mistakes like people do. My point is that when the tab programs came along, they were designed to do the existing tournament practices, only more efficiently. The debate community hasn't seriously thought about whether we can design better practices that can only be done by computers. In other words, we are locked-in to tournament procedures (brackets, speaker points, dropped high-low speaker points) that were designed to be (relatively) easy to do by hand, even though we have phenomenally powerful optimizing devices at our fingertips.

A high-low pairing algorithm literally ranks all the teams and then pairs them off two-by-two. Why not have a computer run 10,000 possible pairings and pick the best one?

I've written another post about lock-in.

Wednesday, January 20, 2010

Differing opponent strengths

Below is a graphic of a traditionally-run tournament.


The horizontal axis shows each team's final strength; the vertical axis shows each team's average opponent strength; the size of the bubble shows, for each team, the standard deviation of its opponents' strengths. A small bubble represents a team that debated opponents that were all very close together in strength. A large bubble represents a team that debated a wide cross-section of opponents, some weak and some strong.

I think about how a debate tournament ought to look, if it's paired fairly. It seems to me that every team ought to have a good cross-section of opponents. Thus, a fair tournament would be like a partial round robin. We would know that 3-3 teams were truly middle-of-the-pack because of their abilities, not because they got an unfair draw. The bubbles in the diagram would be bigger (each team sees a true cross-sections of opponents) and closer to the horizontal line (average opponent strength for each team would be closer to the overall average opponent strength).

It's relatively easy to pair a tournament like this, even on the fly. To pair a round, you can look at each team's opponents and decide what is missing so far. After three rounds, a team might have debated a 0-3, a 2-1, and a 3-0 opponent; they would now debate a 1-2 opponent. It is true that the opponent records change after the fourth round, but the process is repeated, and by the end, most teams will debate a decent cross-section of opponents from 0-6 to 6-0. Of course, traditional tournaments do not do this; teams debate opponents within brackets. Why?

The reason is that brackets increase the accuracy of rankings. Consider a 4-2 team. Does it deserve to break? If the tournament pairs it against a representative cross-section, this team would debate a 6-0 opponent, a 5-1, a 4-2, a 3-3, etc. There's only one opponent with an equal record -- but it's precisely the comparisons to very similarly-abled opponents that shed the most accurate information about a team's true strength. In a brackets system, the same team would likely debate several 4-2 opponents. There are more points of comparison, allowing for finer rankings. The downside, though, is that a team could go through the preliminary rounds of the tournament debating opponents that are all at exactly the same level. It seems to me like something valuable would be lost.

Of course, these two virtues -- fairness and accuracy -- trade off. You can't maximize both. But there are several ways to get a reasonable equilibrium. For example, pair odd rounds to have every team debate a reasonable cross-section of opponents (i.e., across brackets), and pair even rounds to increase accuracy of rankings (i.e., within brackets).