Showing posts with label speaker points. Show all posts

Saturday, February 11, 2017

The Logit Score: a new way to rate debate teams

I recently published an article on a new debate team-rating method I invented, called the logit score. I hope the logit score will take its place among win-loss record, average speaker points, median speaker points, opponent wins, ranks, and so on as an effective way to rate (and thus rank) debate teams at a tournament.

What is the logit score?


The basic idea is simple: the logit score combines win-loss record, speaker points, and opponent strength into one score using a probability model. In other words, the logit score is the answer to the question, "Given these speaker points and these wins and losses to those particular opponents, what is the likeliest strength of this team?"

Let's take a step back and acknowledge a truth not universally acknowledged in debate: results should be thought of as probabilities, not certainties. A good team won't always beat a bad team--just usually. Off days, unusual arguments, mistakes, and odd judging decisions all contribute to a slight risk of the bad team winning. The truly better team won't always prevail. That means actual rounds need to be thought of as suggesting but not definitively proving which team is better. Team A beats team B. Team A is probably better, but then again, they could have had off day, been surprised by a weird argument, or had a terrible judge. If team A got much, much higher speaker points, it was very likely the better team. If team A only edged out team B by a little bit, then the uncertainty grows.

That's where the logit score comes in. Estimating team A's actual, true strength depends on putting together all of those probabilities and uncertainties into one model. I won't get into the specifics (the details are in the article), but the basic idea is using a logistic regression to put the probabilities for wins and losses to specific opponents as well as specific speaker points received together. The logit score for a team means: "If team A were estimated to be stronger, these results would be a bit more likely, but those other results would be far less likely. If team A were estimated to be weaker, these results would be far less likely, even though those other results would be a bit more likely. This logit score is the proper balance that makes all the results most likely overall." Because it factors in all the results in one probability model, the logit score isn't sensitive to outliers: unusually high or low speaker points, losses to outstanding teams, and wins over terrible teams don't affect the logit score much at all.

Does the logit score have any empirical results to back it up?


Yes. This is the bulk of my article.

I took a past college debate season, used those results to give every team a logit score, and then looked to see how well logit scores "retrodicted" the actual results in a season. That is to say, how often did the higher logit scoring team win rounds against the lower logit scoring team? As a baseline of comparison, I also did the same kind of analysis by ranking the teams by win-loss record.

The logit score rankings got slightly more rounds correct than the win-loss record rankings.

The slightly higher accuracy is not, on its own, a reason to rush to adopt logit scores. It merely proves that the logit scores aren't doing anything crazy. For the most part, the logit scores reshuffles teams ever so slightly with their nearest peers. The moves are slight ups or downs, not drastic shifts.

The real reason to consider using logit scores is that (a) they are less sensitive to outliers, which can matter a lot for a six or eight round tournament; and (b) they factor in more information. Win-loss records only use speaker points as a tiebreaker; it's secondary. Measures of opponent strength usually come third. In other words, a team with a really tough random draw and goes 4-2 as a result of dropping the first two rounds might miss out on breaking if no 4-2s break--win-loss record comes first and opponent strength won't factor in in that scenario. The logit score on the other hand--because wins, points, and opponents are all factored in at once--could reflect that this team is in fact very strong because it only lost two rounds to very good opponents. (See how important it is to be less sensitive to outliers?) More information also rewards well-rounded teams: those that win rounds on squeakingly close decisions and don't receive great speaker points are penalized more under a logit score system than a win-loss-then speaker points-system.

Saturday, July 4, 2015

Study of speaker points and power-matching for 2006-7

For my 100th blog post, I did an experiment to try different tabulation methods for debate tournaments. The benefit of an experiment is that the exact strength of each team is known and the simulated tournaments introduced random deviation on performance in each round. The deviation in performance is based on observed results.

The results of the experiment showed that, even after only six rounds, median speaker points is a more accurate measure of a team's true strength than its win-loss record. Furthermore, the results showed that high-low power-matching improved the accuracy of the win-loss record as a measure of strength (but only to the same level of accuracy as median speaker points) and high-high power-matching worsened its accuracy.

Description of the study


This experiment lead me to do an observational study of the 2006-07 college cross-examination debate season. I analyzed all the varsity, preliminary rounds listed on debateresults.com: 7,923 rounds; 730 teams. This was the last year when every tournament used the traditional 30-point speaker point scale. Each team was assigned a speaker point rank from 1 (best) to 730 based on its average speaker points. Each team was also assigned a win-loss record rank from 1 to 730 based on the binomial probability of achieving its particular number of wins and losses by chance. Thus, both teams that had extensive, mediocre records AND teams with few total rounds ended up in the middle of the win ranks.

Next, I analyzed every individual round using the two opponents' point ranks and win ranks. For example, if one team had a good point rank and one a bad point rank, then of course the odds are quite high the good team would win. On the other hand, if the two teams were similarly ranked, then the odds are much closer to even. Using the point ranks, I did a logit regression to model the odds for different match-ups. And I also ran a separate logit regression for win ranks. Here are the regressions:


The horizontal axis shows the difference in the ranks between the two opponents. The vertical axis shows the probability of the Affirmative winning. For example, when Affirmative teams were 400 ranks better (smaller number) than its opponent, they won about 90% of those rounds. These odds are based on the actual outcomes observed in the 2006-07 college debate season.

The belief in the debate community is that speaker points were too subjective -- in the very next season, the format of speaker points was tinkered with and changed. The community settled on adjusting speaker points for judge variability, that is using "second order z-scores." Yet my analysis shows that, over the entire season, the average speaker points of a team is a remarkably good measure of its true strength. Making a lot of adjustments to the speaker points is unnecessary.

First, note how similar the two logistic regressions are. A difference of 100 win ranks, say, is as meaningful for predicting the actual outcomes as a difference of 100 point ranks. Using the point ranks regression "predicts" 75% of rounds correctly, while using the win ranks regression "predicts" 76% correctly. Both regressions "predict" each team's win-loss record with 91% accuracy. (This discrepancy between 75% and 91% occurs because, overall, many rounds are close and therefore difficult to predict -- but for an individual team that has eight close rounds, predicting a 4-4 record is likely to be very accurate.)

What is impressive to me is that, even without correcting for judge bias, the two methods are very comparable. Bear in mind it is NOT because every team receives identical win ranks and point ranks. In fact, as you will see in the next section, some teams got quite different ranks from points and from wins!

Power-matching


In the second part of my analysis, I looked at how power-matching influenced the results. I could not separate out how each round was power-matched because that information was not available through debateresults.com. But college debate rounds tend to be power-matched high-low, which is better than power-matching high-high (as my experiment showed). I eliminated teams with fewer than 12 rounds because they have such erratic results. This left 390 teams for the second analysis.

The goal of power-matching is to give good teams harder schedules and bad teams weaker schedules. Does it succeed at this goal?

No:


I made pairwise comparisons between the best and second-best team, the second- and third-best team, and so on. It is common for two teams with nearly identical ranks to have very different schedules. The average difference in schedule strength is 68 ranks apart out of only 730 ranks, which is almost a tenth of the field! One team may face a schedule strength at the 50th percentile, while a nearly identical team faces a schedule strength at the 60th percentile. Bear in mind that this is the average; in some cases, two nearly identical teams faced schedule strengths 30 percentiles apart! I cannot think of clearer evidence that power-matching fails at its assigned goal.

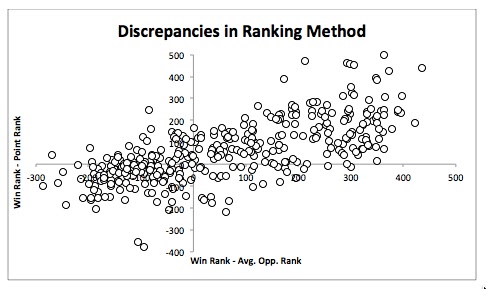
Finally, I performed a regression to see whether these differing schedule strengths is the cause of the discrepancy between win ranks and point ranks.

Yes:


The horizontal axis shows the difference between each team's rank and its schedule strength. The zero represents teams that have ranks equal to schedule strength. The vertical axis shows the difference between each team's win rank and point rank.

Teams in the upper right corner had easier schedules than they should have (under power-matched) and better win ranks than point ranks. Teams in the lower right corner had harder schedules than they should have (over power-matched) and had worse win ranks than point ranks. Having easy schedules improved win ranks; having hard schedules worsened win ranks. The effect is substantial: r^2 is 0.49. Of course, some of the discrepancy between the ranks is caused by other factors: random judging, teams that speak poorly but make good arguments, etc. But power-matching itself is the largest source of the discrepancy.

Given that the schedule strengths varied so much, this is a big, big problem. I know that tab methods have improved since 2006-7 and now factor in schedule strength; this analysis should be rerun on the current data set to see if the problem has been repaired.

Conclusions


  1. Speaker points are just as accurate a measure of true team strength as win-loss record. This confirms the results of my experiment showing that power-matched win-loss record is at rough parity in accuracy to median speaker points.
  2. Power-matching as practiced in the 2006-07 college debate season does not give equal strength teams equal schedules. (This method is probably still in use in many high school tournaments.)
  3. Unequal schedule strengths are highly correlated with discrepancies in the two ranking methods, point ranks and win ranks.


One could argue for power-matching on educational grounds: it makes the tournament more educational for the competitors. However, it is clear from this analysis that power-matching is not necessary to figure out who the best teams are. In fact, it might actually be counterproductive. Using power-matched win-loss records takes out one source of variability from the ranking method -- judges who give inaccurate speaker points -- but adds an entirely new one: highly differing schedule strength!