Plickers is an easy-to-use website/app to do multiple choice review problems in class. All you need is an internet-connected computer, a projector to show the students the questions, and a smartphone with the app. The students hold up answer cards, and you scan their answers with your phone's camera. It works very smoothly!
Harvey Mudd College's math department puts up math fun facts. It is full of really neat stuff! This recommendation was passed on to me by Marc Rios.
Showing posts with label high school math. Show all posts
Showing posts with label high school math. Show all posts
Tuesday, May 26, 2015
Monday, December 29, 2014
Using GeoGebra to teach calculus concepts
GeoGebra is a fantastic tool for demonstrating geometry, algebra, and calculus concepts. (The statistics package is getting pretty good, too.) But I think the hardest part is imagining how to use the program effectively to really demonstrate concepts.
Here are eight demonstrations you can download from me, or watch my videos to figure out how to make them yourself, geared to teaching calculus concepts.
-----
1. I can't quite get the gifs to synch, but the GeoGebra allows the students to look at a composite function for the values where its derivative is 0. The two functions are graphed side-by-side, and students can manipulate the input, see the change in the inside function, and then watch the outside function change.
Of course, the crucial concept is that the derivative of the composite function will be zero when either the inside function or the outside function has a derivative of 0.


Here's link to construction 1, and the video on its construction.
-----
2. Another important concept is understanding that the limit of the Riemann sums approaches the integral as n goes to infinity. The neat part in GeoGebra is that your function can be any squiggle you draw.

Here's the link to construction 2, and the video on its construction.
-----
3. Of course, the most important idea in a calculus class is the fundamental theorem. Students find the fact the f(x) is discontinuous but F(x), the integral of f(x), is continuous challenging. Many students will not, at first, correctly identify that F(x) is continuous but not smooth at 2. Even more students think that the behavior of F(x) at 6 will be more obvious.

Here's the link to construction 3, and the video of its construction.
-----
4. I like this demonstration of Euler's method. GeoGebra is making 100 points using Euler's method. Students can move the initial point around to see how changing the initial value gives them a different particular solution.


Here's the link to construction 5, and the video of its construction.
-----
6. A topic worth reviewing for B.C. Calculus: polar graphing. It is difficult for students to grasp. Even more challenging is visualizing the area integral, but setting up this Riemann sum helps!

Here's the link to construction 6, and the video of its construction.
-----
7. Perhaps the hardest concept of all for students to grasp in an introductory calculus course is Taylor polynomials. This demonstration allows students to see that the error bounds grow smaller each time as the degree of the Taylor polynomial increases.

Here's the link to construction 7, and the video of its construction.
8. OK, also not a calculus concept, but a fun one: the ellipse appears from using the definition that the sum of the two distances to the foci is fixed.

Here's the link to construction 8, and the video of its construction.
Here are eight demonstrations you can download from me, or watch my videos to figure out how to make them yourself, geared to teaching calculus concepts.
-----
1. I can't quite get the gifs to synch, but the GeoGebra allows the students to look at a composite function for the values where its derivative is 0. The two functions are graphed side-by-side, and students can manipulate the input, see the change in the inside function, and then watch the outside function change.
Of course, the crucial concept is that the derivative of the composite function will be zero when either the inside function or the outside function has a derivative of 0.
Here's link to construction 1, and the video on its construction.
-----
2. Another important concept is understanding that the limit of the Riemann sums approaches the integral as n goes to infinity. The neat part in GeoGebra is that your function can be any squiggle you draw.
Here's the link to construction 2, and the video on its construction.
-----
3. Of course, the most important idea in a calculus class is the fundamental theorem. Students find the fact the f(x) is discontinuous but F(x), the integral of f(x), is continuous challenging. Many students will not, at first, correctly identify that F(x) is continuous but not smooth at 2. Even more students think that the behavior of F(x) at 6 will be more obvious.
Here's the link to construction 3, and the video of its construction.
-----
4. I like this demonstration of Euler's method. GeoGebra is making 100 points using Euler's method. Students can move the initial point around to see how changing the initial value gives them a different particular solution.
-----
5. This isn't a calculus concept per se, but I love the baseball problem. It's a great refresher for students on how to do parametric graphing. I set this up so my students could manipulate the windspeed and the angle to figure out the maximum distance a baseball can travel.
Here's the link to construction 5, and the video of its construction.
-----
6. A topic worth reviewing for B.C. Calculus: polar graphing. It is difficult for students to grasp. Even more challenging is visualizing the area integral, but setting up this Riemann sum helps!
Here's the link to construction 6, and the video of its construction.
-----
7. Perhaps the hardest concept of all for students to grasp in an introductory calculus course is Taylor polynomials. This demonstration allows students to see that the error bounds grow smaller each time as the degree of the Taylor polynomial increases.
Here's the link to construction 7, and the video of its construction.
8. OK, also not a calculus concept, but a fun one: the ellipse appears from using the definition that the sum of the two distances to the foci is fixed.
Here's the link to construction 8, and the video of its construction.
Sunday, September 14, 2014
Conics
I did not realize this, but all the conics in a family can be wrapped up in one neat polar equation:
Tip of the hat to Sam for this idea.

Sweet! You can see the shape go through hyperbola, parabola, ellipse, then circle.
The circle is easy. When k = 0, r is a constant 1.
The parabola is not too bad. It happens when k = 1. That means, in parametric form, that
The trick turns out to be squaring the y parametric equation:
We already know this has to be some form of x, so it turns out to be
So there we go.
But it turns out that those are the degenerate forms. The real work is trying to prove that the form given creates hyperbolas when k > 1 and ellipses when 0 < k < 1. Luckily, the same method works for both. Given that in both the hyperbola and ellipse case, the center of the conic is at some (h, 0), we are looking to simplify our polar form into: . For the hyperbola, a will be negative; for the ellipse, a will be positive. The algebra gets a bit tricky, but the idea is simple enough.
Substitute in for x and y:
Then show that, by picking the right values for a, c, and h, it is always possible to get the same ratios of , cosine, and constant in the numerator as the denominator. In other words, one needs to pick the right values such that
The trick is that one can combine and to get rid of the term. Then one is left with the system of equations that:
Solving this by linear combination is not too daunting, actually. For a final answer, one ends up with:
Which is all rather cool. I later realized that k is about the slope at which one cuts a plane through a cone:

When k = 0, the plane is parallel to the cone's base. When k = 1, the plane is parallel to the side of the cone. When k is between 0 and 1, the plane is between parallel to the cone's base and parallel to cone's side. And when k is greater than 1, the plane is steeper than the cone's side. Thanks to Ian Rumsey for making the three-dimensional illustration; here is the GeoGebra file.
Tip of the hat to Sam for this idea.
Sweet! You can see the shape go through hyperbola, parabola, ellipse, then circle.
The circle is easy. When k = 0, r is a constant 1.
The parabola is not too bad. It happens when k = 1. That means, in parametric form, that
The trick turns out to be squaring the y parametric equation:
We already know this has to be some form of x, so it turns out to be
So there we go.
But it turns out that those are the degenerate forms. The real work is trying to prove that the form given creates hyperbolas when k > 1 and ellipses when 0 < k < 1. Luckily, the same method works for both. Given that in both the hyperbola and ellipse case, the center of the conic is at some (h, 0), we are looking to simplify our polar form into: . For the hyperbola, a will be negative; for the ellipse, a will be positive. The algebra gets a bit tricky, but the idea is simple enough.
Substitute in for x and y:
Then show that, by picking the right values for a, c, and h, it is always possible to get the same ratios of , cosine, and constant in the numerator as the denominator. In other words, one needs to pick the right values such that
The trick is that one can combine and to get rid of the term. Then one is left with the system of equations that:
Solving this by linear combination is not too daunting, actually. For a final answer, one ends up with:
.
Which is all rather cool. I later realized that k is about the slope at which one cuts a plane through a cone:
When k = 0, the plane is parallel to the cone's base. When k = 1, the plane is parallel to the side of the cone. When k is between 0 and 1, the plane is between parallel to the cone's base and parallel to cone's side. And when k is greater than 1, the plane is steeper than the cone's side. Thanks to Ian Rumsey for making the three-dimensional illustration; here is the GeoGebra file.
Friday, September 5, 2014
Research on teaching mathematics
I recently ran across the International Society for Design and Development in Education. Their stated goal is to develop standards for creating education materials, like airplane designers follow a standard pattern or method to create new airplanes. While I cannot tell much about what the I.S.D.D.E. actually does from its website, it is an interesting idea, and it got me thinking.
Education ideas come and go. Rather than chase fads, I would like to know what the research says. Does the evidence show unequivocally that an idea helps, or is the evidence mixed or non-existent? When we design new curricula and new materials, what do we know works? Bear in mind, I am not an education researcher, although I did spend considerable time thinking about these issues when I was working my two masters degrees. Since then, I've had seven years of math teaching experience -- as well as a lot of debate teaching experience to compare it to. But please take my opinions with a grain of salt. Of course, it's also incredibly difficult to design good education experiments. Instruction is so multifaceted and so much of teaching is spontaneous that is hard to design good controlled experiments. Still, there is good evidence out there; it is worth knowing.
Education ideas come and go. Rather than chase fads, I would like to know what the research says. Does the evidence show unequivocally that an idea helps, or is the evidence mixed or non-existent? When we design new curricula and new materials, what do we know works? Bear in mind, I am not an education researcher, although I did spend considerable time thinking about these issues when I was working my two masters degrees. Since then, I've had seven years of math teaching experience -- as well as a lot of debate teaching experience to compare it to. But please take my opinions with a grain of salt. Of course, it's also incredibly difficult to design good education experiments. Instruction is so multifaceted and so much of teaching is spontaneous that is hard to design good controlled experiments. Still, there is good evidence out there; it is worth knowing.
Flipping the classroom
The new idea today is "flipping the classroom." Defining a term when its use is exploding is hard because so many people abuse the term. Roughly speaking, I would define flipping the classroom to mean students learn new material for homework and the teacher uses classroom time for practice problems -- the opposite of what typically happens in a math or science class. My definition would imply that humanities classes are, as usually taught, already "flipped." Students read new material at home (a textbook, poem, novel, or other source material), and in class, they discuss, debate, write, and in other ways practice with the ideas, themes, literary techniques, etc. As I read it, the idea of flipping is mainly an idea to improve math and science instruction.
Flipping the classroom makes a lot of sense on face. As a teacher, your most precious resource is your face-to-face class time. Personally, I ask students to do some basic practice problems at home, but I know that I can push them hardest when they are in my class, because I am there to monitor and help them. This aspect of the flipped classroom has immediate, clear appeal.
Flipping the classroom makes a lot of sense on face. As a teacher, your most precious resource is your face-to-face class time. Personally, I ask students to do some basic practice problems at home, but I know that I can push them hardest when they are in my class, because I am there to monitor and help them. This aspect of the flipped classroom has immediate, clear appeal.
The first question is, Can the students learn the material on their own? I have written before about the problems with math textbooks before: students have trouble reading them, or more often, do not even try. On the other hand, I am not a big fan of the students simply watching a video lecture. It is better than not reading the textbook; students will actually watch the video. But watching the lecture is too passive. If you are flipping the classroom, I would advocate for the use of a discovery-based homework set. I provided an interactive example, but a paper version could work, too. With a few leading and thoughtful questions, students could work through the basic ideas. The questions could require looking at an interactive applet online or looking at a few printed examples. They would "read" mostly by doing some calculation or measurement problems, followed by questions that ask them to summarize the new idea.
My model here is the Discovering series. The Discovering Geometry book gives students a construction or two to do before making an observation of a geometric property. Most students can do the constructions and can make the right observation; I think this is manageable for them to do at home. If this discovery was paired with an online quiz -- just a few questions -- student completion would probably be over 90 percent, meaning they would have taught themselves the concept. This kind of model would work for any mathematical topic, but what the students can "discover" on their own depends on their strength as mathematicians and on the difficulty of the topic. The key requirement is that the students must do something right away. Rather than read for 20 minutes (yeah right) and then do examples -- or even watch a video for 20 minutes -- the at-home work must give a quick burst of text or explanation followed immediately by asking the students to do something. Even if the first question is trivial, break up the exposition!
So, good in theory. Is there evidence? So far, just a little, but it is promising. One of the best examples so far is Dr. Mumper at U.N.C.'s School of Pharmacy. He flipped his classes and kept good data on control subjects. Based on quality data, it seems outcomes on the final exam improved by about 5% (or is it 5 percentage points? I cannot tell). Another example is Dr. Mazur at Harvard; he saw real gains for his physics class. It sounds like his method, based on this description, really involved a lot of collaborative student work in class. On the other hand, some professors at Harvey Mudd were not impressed. Right now, the proper attitude is cautiously optimistic; perhaps more evidence will amass for flipping the classroom.
However, the discussion so far about flipping the classroom has focused on "Does it work?" -- rather than the more important question, "Is it worth the effort?" After all, flipping the classroom is a lot of work. Are there other ways to improve math or science teaching that are more effective or require less effort? In other words, a teacher should consider flipping the classroom only if there are no low-hanging fruit left to pick.
To the extent that these experiments were successful, some was probably due to non-integral improvements that happened to come along for the ride. The best experiment of all is not to compare a traditional lecture class to a flipped class. The best experiment of all would be to compare a lecture class that uses every research-supported improvement possible to the flipped class. For example, most flipped classes use short 15-minute video lecture because evidence shows students have trouble absorbing more than that. So, the lecture class' in-class lectures ought to be limited to 15 minutes or fewer as well. And so on. Make every possible improvement to the lecture class that is possible without flipping. My point is merely this: If you want to improve your instruction, but flipping the class is too daunting, do not let that be an excuse for inaction. There are plenty of ways to improve your class.
On the one hand, the idea of flipping is so radical that it forces instructors to rethink everything. I am sure plenty of instructors do need to rethink every part of their practice because all of it needs improvement! On the other hand, making a whole lot of improvements, even if they are less radical than flipping the class, might have an even greater combined effect on student learning.
Interleaving
One of the clearest memory effects is for interleaving. The idea is to overlap two or more topics in time. (While I think integrating the topics is also worthwhile -- making connections between topics -- the research shows enormous retention benefits just for mixing the units of study together.) Students might study logarithms for a week, then polynomials for a week, then back to logarithms. All the while, they have mixed review homework. This might sound like it would confuse the students, but because they have so many more opportunities to recall and use the ideas, they remember it much better. The evidence here is solid. Here is one example of its use in a pre-algebra class.In my own personal experience, I found it was enormously effective. I took my A.P. Statistics class and interleaved the topics: one week of experimental or sampling design, one week of probability, one week of descriptive statistics, and one week of statistical inference, then "unit" test. We kept that rotation schedule, with some minor modifications, all school year. I made no other changes -- I used the same textbook, same problem sets, and same in-class activities and projects. The result? The average of my students' scores on the A.P. exam jumped by almost a whole point (out of 5 possible points on the A.P.). It is not because they understood the material better, but because they had review built-in every month.
I would assume that the best model for interleaving is one where frequency drops off but the difficulty increases. For example, a student might be introduced to a basic logarithm concepts on day one; perhaps the student learns how to rewrite a logarithm as an exponential equation. On days two and four and six, the students sees basic logarithm questions again (say, where the bases and exponents are all nice numbers). Then on days nine and twelve, the student sees medium difficulty logarithm questions (perhaps one of the numbers, a base or exponent, requires some fractional thinking). Four days pass, and on day 16, the student sees a medium-to-high difficulty-level question (now he has to rewrite a logarithmic equation into exponential form where there are no numbers, only variables).
While this may seem like a slow pace for teaching one concept, remember that other concepts are being introduced at the same time. Maybe 50% of the work students do is concepts they only learned in this week of class; 25% might be review from the two or three previous weeks; and the last 25% could be review from a month ago or more. This mixture can keeps homework challenging. (It drives me crazy that every problem in one section requires finding a right triangle; and in another section, an isosceles triangle. It is ridiculously too easy to solve homework problems if every one uses the same concept.) At the beginning of the year, teachers could interleave new topics with review topics from the previous year.
The simplest way to interleave is simply to do the sections in a typical textbook in mixed order. That is what we did in my Statistics class: chapter 1.1 to 1.3, then 4.1 to 4.4, then 8.1 and 8.2, then back to 1.4 to 1.6, then 4.5 to 4.7, and so on. In this regard, it is simple to implement. A teacher only needs to plot out the sequence of sections for the year, and then make sure no prerequisite skills or concepts are out of sequence. Before assigning homework problems, the teacher can check that the students are able to do each one -- sometimes textbooks do throw in unlabeled mixed review problems. Of course, it is even better if the teacher can integrate the concepts, as well as interleave, if there are times where a connection can be made between two different topics.
Group work
According to Robert Slavin on the BEE website (Best Evidence Encyclopedia), the research comparing different primary and secondary curricula has a clear result: curricula in which the students work in small teams of two to four, perhaps with alternating roles (once as the "teacher" and once as the "student," for example), are the most effective. In other words, collaborative-learning oriented curricula all show greater positive effects than other kinds of curricula. His research doesn't address the why question, but I have some guesses.First, I think students get more exposure to metacognitive thinking in group work. As they discuss a problem, someone tends to say, "What are we trying to solve?" or "Can we draw a diagram?" Students working on their own tend to try one strategy and succeed or give up; students in groups are more likely to compare and evaluate different strategies.
Second, I suspect curricula with built-in group work tend to ask students more interesting questions. "Solve for x" using a known algorithm is a boring question to discuss; "extend your knowledge of this algorithm to suggest two different methods to find x" in a novel context is a great discussion question. And the questions can be more difficult, since the students have each other to rely upon.
Third, a solid group-work protocol is probably helping the weakest teachers more than the best teachers. The best teachers already know how to draw out metacognitive thinking and already know how to ask interesting, challenging questions. Changing to a different curriculum will help the best teachers only marginally. On the other hand, the weakest teachers have a lot of room for improvement. Yet a new curriculum with topics in a different order or presented differently will probably help them very little. However, a curriculum with group-work built in will help the weakest teachers address their biggest weakness: drawing out student thinking. My point is that the strong evidence in favor of collaborative-learning curricula probably is due to some very differential effects based on teacher quality.
Simple cognitive models
Here's where we get international. Many nations that have very strong mathematics education explain concepts through simple cognitive models that are continually revisited, practiced, and extended. (See Willingham's article, p. 19, for a Singapore example; exit 10A also posted a nice example of a simple visual model for division, before teaching students the traditional division algorithm; many, many more abound.) The idea is to develop easy-to-understand models and use them over and over again to reinforce the concept.The simple cognitive model approach has been used successfully by many national curricula. What do we have in the U.S.? Dolphins. I wish I were exaggerating. Scroll down to Mr. Aggarwal's statement. The thing that is so frustrating is that there is a simple cognitive model for the distributive property: the box method.

This example is (x+3)(2x + y + 4). The model should be built upon an area model of multiplication. I would start with one-by-one rectangles with two numbers, then move to one-by-one rectangles with one variable, and so on, always making sure students understood the answers to be areas. A question that would test whether students understood this is: "Which is bigger: 6x or 3y?" Of course, the answer is that they are incommensurate, until we know both x's and y's values.
The box method is extensible to factoring, to complex number multiplication, to completing the square, and more. It is firmly rooted in geometric thinking and makes the connection that multiplication is just repeated addition: 3x = x + x + x is a great diagram with which to start using the box method with variables. Strictly algebraic methods tend to be lost on the students, except for perhaps 5-10% who are very algebraically-oriented. But this subset of students will understand a visual or geometric explanation anyway, and the algebraic, procedural approach ought to follow later once the simple cognitive model is fully grasped.
The idea with simple cognitive models is to pick ones that can be re-used; that way, new ideas can be strongly connected back to old ones.
Metacognition
Metacognition matters. Even simple mathematical procedures require mastering a flow of steps. Students who are able to manage themselves through the steps -- recognizing when something has gone wrong, rethinking assumptions, checking solutions for reasonableness, comparing the efficiency of two different methods -- are at an advantage.On the other hand, it is easy to overstate the importance of metacognition. Students who have poor working memory are going to struggle to add another layer of thinking -- and working memory is more or less fixed. Furthermore, metacognition, also known as critical thinking, is domain-specific. The strategies are different for different subjects.
Yet metacognition is an important set of skills to work on. For the weakest students, it will be a challenge. But that's why metacognition should be deeply ingrained in the culture of doing math. The teacher can model estimating, stating assumptions, and checking solutions. The teacher can expect and require that students always verbalize thinking, and the classroom can have a culture of error-checking and seeking multiple solutions.
Even though metacognition is domain-specific, all we care about is that students learn mathematical problem-solving skills. They should know techniques like: draw a diagram, make a table of values, list knowns and unknowns, mark congruences, solve simpler problems first, try to identify a pattern, add an auxiliary line, de-layer a problem, model with a function, model in a graphing program like GeoGebra, write down theorems that seems applicable, see if a theorem can be extended (e.g., "Can you extend the Pythagorean theorem to three dimensions?"), look for class-inheritance of ideas (e.g., all the properties of isosceles triangles are true for equilateral triangles, too), write clear definitions with clear conditions, look for contrapositives of known theorems, and many more. These techniques are all math-specific. However, the more general skills, such as self-reflection, can help in many other subjects.
Metacognitive strategies matter, especially for the weakest students. Thinking is hard work, and students need tools to help them.
More testing
There's good research on how effective the pre-test can be. Unfortunately, the pre-test is especially challenging to design for mathematics; students may not even know how to interpret the questions, negating any possible benefit to the early exposure to the concepts.However, frequent, low-stakes quizzes are also incredibly beneficial to memory and learning, for almost the same reason as the pre-test. Quizzes expose false fluency, the student's false belief that he or she understood the concept.
Traditional vs. modern methods
Some researchers have found data that traditional teaching methods are correlated with high student achievement. Yet other analyses have found the exact opposite looking at the same data. The key issue is lurking variables. Stronger students allow a teacher to default to more traditional methods; weaker students cause the teacher to use more modern methods. Another issue is that this is all self-reported data. Younger teachers, who more recently were in education programs and heard more about the benefits of modern methods, might use or might report using more class time for modern methods. Since these teachers are younger, they are also likely to be weaker as well. Alternatively, it is possible that modern methods work better than traditional lectures in the hands of expert teachers but utterly fail in the hands of weaker teachers. If the weakest teachers can manage an acceptable lecture, then modern methods would have the lower overall average.A final issue is that the tests may not measure reasoning skills very well. Altogether, the research is good that traditional methods promote memorization. There is a lot of experimental research, not observational studies, on this question. And here is a meta-analysis showing that lecture methods are inferior to more active ones.
Here is another article on the benefits of testing frequently and the benefits of interleaving.
Friday, August 22, 2014
Formulas for any transformation
As a geometry teacher, I find that I often want to give my students a transformation rule and see if they can identify the type of transformation. But making up transformation rules one-by-one got tiring. So I sat down and figured out the general form of each kind of transformation rule: the general form for any reflection, the general form for any rotation, and the general form for any dilation.
Here are the results. Enjoy!
Here are the results. Enjoy!
Sunday, July 6, 2014
Writing polynomial functions
Let's say you need to write a polynomial function that exactly goes through certain points. For example, let's say you need a polynomial that will go through (1, 3), (2, 8), and (4, 2). The easiest way to do this is by splitting your polynomial into three parts: f(x) = A(x) + B(x) + C(x). The trick is that A(1) = 3, B(1) = 0, and C(1) = 0; B(2) = 8, A(2) = 0, and C(2) = 0; and C(4) = 2, A(4) = 0, and B(4) = 0. Because A(1) = 3, A(2) = 0, and A(4) = 0, therefore A(x) = (x - 2)(x - 4).
Likewise, because B(2) = 8, B(1) = 0, and B(4) = 0, therefore B(x) = -4 (x - 1)(x - 4).
And finally, because C(4) = 2, C(1) = 0, and C(2) = 0, therefore
That means our final function is
Of course, one can simplify it into a traditional quadratic, or one can just leave it in this form. Tip of the hat to Marc Rios for alerting me to this method, attributed to Lagrange.
Wednesday, March 26, 2014
Similarity
Similarity comes in handy in proving a number of neat geometry properties, although I do not usually see it used the proofs in textbooks (the bias is clearly toward congruent triangle-based proofs). One I have already mentioned before is proving the Pythagorean theorem through similarity.


Centroid
The centroid divides the median lines of a triangle in a 1:2 ratio. How to prove it? The easiest way is to start with a trapezoid.
In this trapezoid, side AB is parallel to side CD. This means that, from the alternate interior angle theorem, angles BCD and CBA are congruent and also angles ADC and DAB are congruent. By angle-angle similarity, we know triangles CDE and BAE are similar. Now we are ready to move on to medians:
Point C is the midpoint of side AF, and point D is the midpoint of BF. Therefore, segments MC and AD are medians, and point E is the centroid. Segment CD is a midsegment of triangle ABF, which means we know it is half the length of segment AB. In this diagram, we know triangles CDE and BAE are similar -- and by the midsegment theorem, we know the ratio is 1:2. Now we can show that segment CE is half the length of BE, and segment DE is half the length of AE. We have our proof of the centroid property.
Angle bisector
The angle bisector property is another easy one to prove with similarity.
Here is another trapezoid, with side AB is parallel to side CD, and where angle BAC is bisected by segment AD. We know angles ADC and DAB are congruent by the alternate interior angles theorem, which means ADC and DAC must be congruent as well. This shows us that triangle ADC is isosceles, with segments AC and DC being congruent.
Furthermore, as in the problem before, we know that triangles CDE and BAE are similar. Therefore, we can say that DC/CE=AB/BE, and since we know AC = DC, we know that AC/CE=AB/BE. There is our proof of the angle bisector theorem.
1. Two crossing chords in a circle create similar triangles:

F, the point of intersection of chords DE and BC, is not the center of the circle. Because inscribed angles CDE and CBE both intercept the same arc CE, these angles must be congruent. Angles CFD and EFB are congruent vertical angles, so this means triangles CDF and EBF and similar by the angle-angle similarity theorem. This sets up the useful proportion that CF/DF = EF/BF.
2. Two crossing secants in a circle create similar triangles:

Like before, G is not the center of the circle. Because inscribed angles BCF and FEB both intercept the same arc FB, they are congruent. Although with the common angle BDF, we can show that triangles CDF and EDB are similar by angle-angle similarity. This sets up the useful proportion that BD/ED = FD/CD.
A line with a slope of 1/7 passes through (12, 2). What is the y-intercept?

The blue triangle has a slope of 1/7, and it is similar to the red triangle, of course. The proportion 12/7 = y/1 will find the height of the red triangle, y. Therefore, the y-intercept is 2 - y.
Circles
1. Two crossing chords in a circle create similar triangles:
F, the point of intersection of chords DE and BC, is not the center of the circle. Because inscribed angles CDE and CBE both intercept the same arc CE, these angles must be congruent. Angles CFD and EFB are congruent vertical angles, so this means triangles CDF and EBF and similar by the angle-angle similarity theorem. This sets up the useful proportion that CF/DF = EF/BF.
2. Two crossing secants in a circle create similar triangles:
Like before, G is not the center of the circle. Because inscribed angles BCF and FEB both intercept the same arc FB, they are congruent. Although with the common angle BDF, we can show that triangles CDF and EDB are similar by angle-angle similarity. This sets up the useful proportion that BD/ED = FD/CD.
Finding a y-intercept
A line with a slope of 1/7 passes through (12, 2). What is the y-intercept?
The blue triangle has a slope of 1/7, and it is similar to the red triangle, of course. The proportion 12/7 = y/1 will find the height of the red triangle, y. Therefore, the y-intercept is 2 - y.
Friday, March 7, 2014
California's high school exit exam
It never occurred to me, in all the years of doing this blog, to post my thesis until today. But I started an account at Academia.edu, so that made me realize I should. Here is the short, article length version:
Thursday, March 6, 2014
Lock-in 2
I have written about the concept of lock-in before, but it is an idea I keep coming back to. Rather than starting from the assumption that systems and institutions have been designed rationally, we should think about them historically, trying to unearth all the contingent twists and turns that got us to where we are today.
Which is to say path dependence is a lot more important than we normally view it. What has come before makes certain next steps easier and more likely than others. Rarely does anyone make a from-scratch, all-factors-considered in rational-long-term-planning decision (especially in democracies where power is dispersed). So people muddle through.
One example is fossil fuels. All sorts of things happened along the way that got us to where we are today. But now that we ARE here, and lock-in means that we have designed systems, and have settled expectations, on what energy should and should not be able to do. For example, we built long-distance interstate highways because internal combustion vehicles could travel hundreds of miles before needing to refuel. We spent money on that instead of developing other interstate travel systems. Now we think electric vehicles ought to be able to travel hundreds of miles before recharging... because we have those roads to use, and we always have been able to do. This is insane demand on electric vehicles. They are clearly perfectly fine for intracity use (although prices for electric vehicles are still too high). Renting a gas-powered car for long-haul drives, or finding a different way to do these trips, would allow us to use electric vehicles 95% of the time. But re-setting expectations is hard.
As far as I understand economists' answer to this question -- and I admit I do not really understand their answer -- is that high prices will lead people to substitute. In other words, once electric vehicles are cheaper than gas vehicles, people will make the switch (in the basic economic models). But this is too much of an assumption for me to accept; many substitutions are not easy. There are always trade-offs. Nothing does exactly what gasoline does. The basic economic models say that as soon as the prices of electric vehicles come down, their use will skyrocket, but differences from gas vehicles will slow their adoption. And even if it does not slow adoption, lock-in to the existing set of automobile capabilities has slowed the development of electric cars. Everyone has worked hard to emulate the existing capabilities without asking what the from-scratch design might look like.
Apparently, the transition from wood to coal was kind of rough.
Here is another great example of lock-in: California's water system.
I believe there is also a lock-in on the subjects covered in high school. If I had to organize all human knowledge simply, I would split it into three main branches: literature and arts, natural sciences, and social studies (economics, history, etc.). There are areas of overlap, too: mathematics, for example, is both art and science. The typical high school curriculum actually covers all of these main branches: students must read and analyze literature, often take art classes, and must also cover basic sciences and mathematics. But I have two specific examples of lock-in in mind. [Note: I am a little worried that the ideas below, which I heard from a professor in grad school, are a just-so story. But the information I can find on the history of U.S. curriculum is scarce. If you had access to contradictory information, please pass it along so I can correct my post.]
Why is it the focus of the high school social studies curriculum is history? And why is writing taught in literature classes? Mostly, the students are expected to write expository papers, so, although the analysis of literature exposes them to different rhetorical techniques, it does not expose the students to garnering evidence and putting together a clear position. Social studies would obviously make a lot more sense.
The short answer is Charles Eliot and the Committee of Ten:
From EducationNext. The public high school movement was gaining momentum but their curricula were all different, which made it hard for Harvard and the others to decide whom to admit. Enter a standardized core, suggested by this influential committee: Latin, Greek, English, modern languages, mathematics, sciences, natural history, history, and geography. Of course, it is easier to cut subjects than to add new ones to the list. Latin and Greek were eventually eliminated. Geography is still taught in some middle schools but not at a high school level, and natural history is now mostly subsumed by biology and earth sciences. Nothing new has been added to the list for a century (really, not even computer science makes the required subjects list?).
This is not to say that high school education today looks like it did a century ago; it looks dramatically different, far less focused on the classic literature of Latin and Greek. But the basic structure remains the same, so history is still the clear focus of high school social studies, despite some attempts to broaden it, for, ahem, mostly historical reasons. In most U.S. high schools, students take world history for two years, perhaps split up into ancient civilizations and modern civilizations, plus U.S. history for another year. Maybe senior year includes an elective on economics, political science, or yet another history class. So history comprises, for most students, 75% or more of their high school social studies curriculum. One example of lock-in from a century ago, when history and the classics formed the core of collegiate learning. (For example, at Harvard, economics became a separate department in 1897, birthed from the History, Government, and Economics department; sociology was first added in 1931; and psychology was added in the 1880s -- I cannot get a definite date. Before the 1880s, the classics held outmoded weight.)
Now to the other question. Why is writing mostly taught in literature class? While I am out of my zone of expertise here, my guess is two-fold. First, because students in those days were expected to read the classics in Latin and Greek, I would guess the English class read far less literature than today (indeed, most English-language literature would have been looked down upon as "popular" and trashy). With less literature to read, their English class would have had a lot more time to focus on grammar, rhetoric, and yes, exposition and argument. I believe the English class then was seen as inheritor of the trivium.
Second, I think writing expository papers ended up in English, not social studies, because the history research paper is especially challenging for students. If social studies classes covered a broader range of topics of economics, politics, or ethics, it might be easier to get those students writing basic position papers. I know good history teachers have the students write multiple in-class or homework essays, but these presume a right answer. "Essay" is really a misnomer. The evidence is just facts they already learned from the textbook. Yet staking an original position and doing research on it is intimidating in a history course. Less so when the topic is, "A flat tax is efficient and fair." Anyone with an Internet connection can dig into that topic; it is not intimidating at all. One vision about such a course -- an open-ended inquiry course, broader than just covering a fixed set of facts -- was presented appealing in Neil Postman's Teaching as a Subversive Activity. Or really in any debate-across-the-curriculum book.
Consider, as another example of high school curriculum lock-in, the two types of Advanced Placement math exams: A.B. and B.C. Calculus, on the one hand, versus Statistics. More than twice as many students take the Calculus exams than take the Statistics exam, although Statistics is growing more rapidly. The Calculus exam was first given in 1956; the Statistics exam was first given in 1996. When the Calculus exam was first given, it was kind of a rarity that students would get to Calculus in high school. Most students finished with Geometry or perhaps Advanced Algebra with Trigonometry. The sine qua non of a rigorous high school program was students got to Calculus -- less about the student than the school, in a way. Now, it is not really such a rarity anymore. A lot of students do take Calculus, but the Calculus exam has not lost its imprimatur for college admissions.
However, there are several compelling reasons for a lot of students to prefer taking a Statistics course to a Calculus course: 1) statistics will be more beneficial in the college studies of students intending to study biology, psychology, or other social sciences than calculus, which is only necessary for math and engineering students; 2) statistics is more important for being a well-informed citizen; and 3) statistics is a mode of thinking that can be applied to a lot of situations. Self-selection is an important concept to understand in many contexts. But the A.P. Statistics exam is seen as an inferior marker of a rigorous high school math preparation and probably always will be.
Or, in a more general turn, why not develop a more general exam of basic mathematical knowledge we expect high school students to know, from modeling to manipulating functions to probability to vectors and trigonometry? I think this is what the I.B. exams (S.L. or H.L.) attempt to do. But this may never, in the U.S. at least, replace the Calculus exam. It all comes down to an initial decision, back in the 50s, to write a subject specific exam, rather than a cumulative, general mathematics exam. The latter is less locked-in and can evolve; the former less so. The fact of the Calculus exam implies that mathematics is a sequential, hierarchical ladder and the goal is to get to the top as fast as you can. This is false on both counts.
Here is another example, a special pet peeve of mine: the Texas Instruments calculator.

From: mathwithbaddrawings. Hilarious! Please visit his site. My analysis:
The iPod touch: 67 times faster; 11,000 times more ram; 22,000 times more storage. But the iPod costs only slightly more than twice. The TI-84 calculator was on the cutting edge a long time ago, then math textbooks included examples using the calculator, then the A.P. exams decided to allow calculator use. Now we are locked-in on the TI-84 calculator until -- and it will happen soon -- the College Board is ready certify some iOS apps as exam appropriate. This will require a lock-out feature (i.e. an app must have a time lock that prevents leaving the app, so no one can text or use the Internet during the test).
One final example of lock-in. Did you know the National Speech and Debate Association, formerly the National Forensic League, does NOT write policy debate topics for high school? (The N.S.D.A. does write the Public Forum and Lincoln Douglas topics.) Policy topics are written by the National Federation of State High School Associations. As you can tell from this screen shot, the organization's focus is on sports. Football, baseball, soccer, and basketball all get a visual:

You can see debate in the left-hand links. So why is a sports organization also organizing debate? My guess: the N.F.H.S. was founded in 1920. The N.F.L. was founded in 1925. This is also -- again, my guess -- why state championship speech and debate tournaments are separate from N.F.L. (now N.S.D.A.) qualifiers. And why moot court and model U.N. aren't part of the same organization. Perhaps it was some organizational rivalry at the time.
Which is to say path dependence is a lot more important than we normally view it. What has come before makes certain next steps easier and more likely than others. Rarely does anyone make a from-scratch, all-factors-considered in rational-long-term-planning decision (especially in democracies where power is dispersed). So people muddle through.
One example is fossil fuels. All sorts of things happened along the way that got us to where we are today. But now that we ARE here, and lock-in means that we have designed systems, and have settled expectations, on what energy should and should not be able to do. For example, we built long-distance interstate highways because internal combustion vehicles could travel hundreds of miles before needing to refuel. We spent money on that instead of developing other interstate travel systems. Now we think electric vehicles ought to be able to travel hundreds of miles before recharging... because we have those roads to use, and we always have been able to do. This is insane demand on electric vehicles. They are clearly perfectly fine for intracity use (although prices for electric vehicles are still too high). Renting a gas-powered car for long-haul drives, or finding a different way to do these trips, would allow us to use electric vehicles 95% of the time. But re-setting expectations is hard.
As far as I understand economists' answer to this question -- and I admit I do not really understand their answer -- is that high prices will lead people to substitute. In other words, once electric vehicles are cheaper than gas vehicles, people will make the switch (in the basic economic models). But this is too much of an assumption for me to accept; many substitutions are not easy. There are always trade-offs. Nothing does exactly what gasoline does. The basic economic models say that as soon as the prices of electric vehicles come down, their use will skyrocket, but differences from gas vehicles will slow their adoption. And even if it does not slow adoption, lock-in to the existing set of automobile capabilities has slowed the development of electric cars. Everyone has worked hard to emulate the existing capabilities without asking what the from-scratch design might look like.
Apparently, the transition from wood to coal was kind of rough.
Here is another great example of lock-in: California's water system.
I believe there is also a lock-in on the subjects covered in high school. If I had to organize all human knowledge simply, I would split it into three main branches: literature and arts, natural sciences, and social studies (economics, history, etc.). There are areas of overlap, too: mathematics, for example, is both art and science. The typical high school curriculum actually covers all of these main branches: students must read and analyze literature, often take art classes, and must also cover basic sciences and mathematics. But I have two specific examples of lock-in in mind. [Note: I am a little worried that the ideas below, which I heard from a professor in grad school, are a just-so story. But the information I can find on the history of U.S. curriculum is scarce. If you had access to contradictory information, please pass it along so I can correct my post.]
Why is it the focus of the high school social studies curriculum is history? And why is writing taught in literature classes? Mostly, the students are expected to write expository papers, so, although the analysis of literature exposes them to different rhetorical techniques, it does not expose the students to garnering evidence and putting together a clear position. Social studies would obviously make a lot more sense.
The short answer is Charles Eliot and the Committee of Ten:
There is little dispute about the historical importance of the report of the Committee of Ten. Appointed by the National Education Association (NEA), the committee, composed mainly of presidents of leading colleges, was charged with establishing curriculum standardization for public-high-school students who intended to go to college. During the previous half century, from roughly 1840 to 1890, the public high school had gradually emerged from the shadow of the private academy. While enrollments were still small by today’s standards (probably less than 5 percent of American teenagers attended public high school in the post-Civil War era), by the 1870s and 1880s the number of public secondary schools was increasing fast enough to occasion some attention. And the Committee of Ten was convened to bring some order to the varied curricula that were growing with them. Under the leadership of Charles Eliot, president of Harvard University, the committee undertook a broad and comprehensive exploration of the role of the high school in American life, concluding, significantly, that all public-high-school students should follow a college preparatory curriculum, regardless of their backgrounds, their intention to stay in school through graduation, or their plans to pursue higher education.
From EducationNext. The public high school movement was gaining momentum but their curricula were all different, which made it hard for Harvard and the others to decide whom to admit. Enter a standardized core, suggested by this influential committee: Latin, Greek, English, modern languages, mathematics, sciences, natural history, history, and geography. Of course, it is easier to cut subjects than to add new ones to the list. Latin and Greek were eventually eliminated. Geography is still taught in some middle schools but not at a high school level, and natural history is now mostly subsumed by biology and earth sciences. Nothing new has been added to the list for a century (really, not even computer science makes the required subjects list?).
This is not to say that high school education today looks like it did a century ago; it looks dramatically different, far less focused on the classic literature of Latin and Greek. But the basic structure remains the same, so history is still the clear focus of high school social studies, despite some attempts to broaden it, for, ahem, mostly historical reasons. In most U.S. high schools, students take world history for two years, perhaps split up into ancient civilizations and modern civilizations, plus U.S. history for another year. Maybe senior year includes an elective on economics, political science, or yet another history class. So history comprises, for most students, 75% or more of their high school social studies curriculum. One example of lock-in from a century ago, when history and the classics formed the core of collegiate learning. (For example, at Harvard, economics became a separate department in 1897, birthed from the History, Government, and Economics department; sociology was first added in 1931; and psychology was added in the 1880s -- I cannot get a definite date. Before the 1880s, the classics held outmoded weight.)
Now to the other question. Why is writing mostly taught in literature class? While I am out of my zone of expertise here, my guess is two-fold. First, because students in those days were expected to read the classics in Latin and Greek, I would guess the English class read far less literature than today (indeed, most English-language literature would have been looked down upon as "popular" and trashy). With less literature to read, their English class would have had a lot more time to focus on grammar, rhetoric, and yes, exposition and argument. I believe the English class then was seen as inheritor of the trivium.
Second, I think writing expository papers ended up in English, not social studies, because the history research paper is especially challenging for students. If social studies classes covered a broader range of topics of economics, politics, or ethics, it might be easier to get those students writing basic position papers. I know good history teachers have the students write multiple in-class or homework essays, but these presume a right answer. "Essay" is really a misnomer. The evidence is just facts they already learned from the textbook. Yet staking an original position and doing research on it is intimidating in a history course. Less so when the topic is, "A flat tax is efficient and fair." Anyone with an Internet connection can dig into that topic; it is not intimidating at all. One vision about such a course -- an open-ended inquiry course, broader than just covering a fixed set of facts -- was presented appealing in Neil Postman's Teaching as a Subversive Activity. Or really in any debate-across-the-curriculum book.
Consider, as another example of high school curriculum lock-in, the two types of Advanced Placement math exams: A.B. and B.C. Calculus, on the one hand, versus Statistics. More than twice as many students take the Calculus exams than take the Statistics exam, although Statistics is growing more rapidly. The Calculus exam was first given in 1956; the Statistics exam was first given in 1996. When the Calculus exam was first given, it was kind of a rarity that students would get to Calculus in high school. Most students finished with Geometry or perhaps Advanced Algebra with Trigonometry. The sine qua non of a rigorous high school program was students got to Calculus -- less about the student than the school, in a way. Now, it is not really such a rarity anymore. A lot of students do take Calculus, but the Calculus exam has not lost its imprimatur for college admissions.
However, there are several compelling reasons for a lot of students to prefer taking a Statistics course to a Calculus course: 1) statistics will be more beneficial in the college studies of students intending to study biology, psychology, or other social sciences than calculus, which is only necessary for math and engineering students; 2) statistics is more important for being a well-informed citizen; and 3) statistics is a mode of thinking that can be applied to a lot of situations. Self-selection is an important concept to understand in many contexts. But the A.P. Statistics exam is seen as an inferior marker of a rigorous high school math preparation and probably always will be.
Or, in a more general turn, why not develop a more general exam of basic mathematical knowledge we expect high school students to know, from modeling to manipulating functions to probability to vectors and trigonometry? I think this is what the I.B. exams (S.L. or H.L.) attempt to do. But this may never, in the U.S. at least, replace the Calculus exam. It all comes down to an initial decision, back in the 50s, to write a subject specific exam, rather than a cumulative, general mathematics exam. The latter is less locked-in and can evolve; the former less so. The fact of the Calculus exam implies that mathematics is a sequential, hierarchical ladder and the goal is to get to the top as fast as you can. This is false on both counts.
Here is another example, a special pet peeve of mine: the Texas Instruments calculator.
From: mathwithbaddrawings. Hilarious! Please visit his site. My analysis:
TI-84 calculator:
15 MHz processor, 24 KB ram,1.5 MB flash storage, b&w screen
$110
iPod touch:
1 GHz processor, 512 MB ram, 16 GB flash storage, color screen
$229
The iPod touch: 67 times faster; 11,000 times more ram; 22,000 times more storage. But the iPod costs only slightly more than twice. The TI-84 calculator was on the cutting edge a long time ago, then math textbooks included examples using the calculator, then the A.P. exams decided to allow calculator use. Now we are locked-in on the TI-84 calculator until -- and it will happen soon -- the College Board is ready certify some iOS apps as exam appropriate. This will require a lock-out feature (i.e. an app must have a time lock that prevents leaving the app, so no one can text or use the Internet during the test).
One final example of lock-in. Did you know the National Speech and Debate Association, formerly the National Forensic League, does NOT write policy debate topics for high school? (The N.S.D.A. does write the Public Forum and Lincoln Douglas topics.) Policy topics are written by the National Federation of State High School Associations. As you can tell from this screen shot, the organization's focus is on sports. Football, baseball, soccer, and basketball all get a visual:
You can see debate in the left-hand links. So why is a sports organization also organizing debate? My guess: the N.F.H.S. was founded in 1920. The N.F.L. was founded in 1925. This is also -- again, my guess -- why state championship speech and debate tournaments are separate from N.F.L. (now N.S.D.A.) qualifiers. And why moot court and model U.N. aren't part of the same organization. Perhaps it was some organizational rivalry at the time.
Wednesday, February 26, 2014
Set, Jr.
Set is a fun game that taxes working memory like none other. The game consists of several cards, and each card has one or more shapes on it. The cards differ in number (1, 2, or 3 shapes per card) and in color (red, green, or purple), and there are three types of shape (diamonds, ovals, and squiggles). This means the Set, Jr. deck consists of 3^3 = 27 cards. The regular Set game introduces shading (solid, outlined, and striped), thus its deck has 3^4 = 81 cards. In both versions, the goal is to make a set of three cards. On every one of the characteristics, the cards must all differ or all be the same. For example, two green squiggles (G2S), two green diamonds (G2D), and two green ovals (G2O) make a set: all the same number, all the same color, and three different shapes. On the other hand, two red squiggles (R2S), two red diamonds (R2D), and three red ovals (R3O) do not make a set, but if the first card had one red squiggle, they would make a set.
If I pick a card at random, how many possible sets can I make? Let's say I pick one green oval card as my initial seed. Here are all the possible sets:
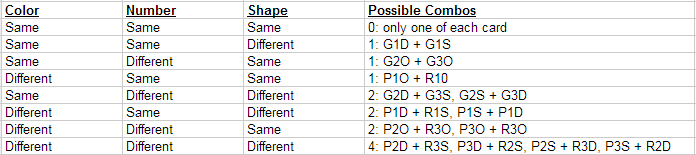
It turns out that there are exactly 13 sets. And I noticed that every other card in the deck was used once and only once. And 13 happens to be a very intriguing number: it is the number of tic-tac-toes possible that pass through the middle square in a 3-dimensional game. Visualize it and count it up.
It is possible to arrange the 27 cards into a 3-by-3-by-3 cube arrangement, with the one green oval card in the very middle, and have every line through it yield a set:

Every one of the 13 sets is there, through the G1O card.
But I happened to notice that this arrangement also yielded all sorts of other sets not involving the G1O card. Every horizontal line, every vertical line, and every diagonal line is a set. In fact, if you took off the lower level of the cube and moved it on top of the upper level, every horizontal, vertical, and diagonal (following tic-tac-toe rules) line would be a set. And this also holds true if you took off the left face of the cube and moved it to the right of the right face. And so on. In fact, if this cube is tessellated by translation to fill up a 3-dimensional space, every horizontal, vertical, and diagonal line in that whole space will be a set! (This took quite a while to corroborate, but I am 99% sure I did not make any mistakes when I checked this.)
Every line in the space is a set. So does that mean the space contains ALL possible sets? How many sets are possible in the deck? That is easy: 27 cards to pick as initial seed times 13 sets with each card divided by 3 because each unique set is counted three times (once per each one of its cards as the initial seed). There are therefore 117 sets. How many lines in the space? This was a lot harder to figure out. Here are possible orientations of the lines:
(The diagonal lines have to follow tic-tac-toe rules.) For each orientation of line, there are nine possible parallel lines. I tried to come up with a neat visual of this, but it is really hard to do. Anyway, 9 x 13 = 117 lines in the set. Yes, I think the space contains all possible sets.
What about the regular Set game and a 4-dimensional space?
If I pick a card at random, how many possible sets can I make? Let's say I pick one green oval card as my initial seed. Here are all the possible sets:
It turns out that there are exactly 13 sets. And I noticed that every other card in the deck was used once and only once. And 13 happens to be a very intriguing number: it is the number of tic-tac-toes possible that pass through the middle square in a 3-dimensional game. Visualize it and count it up.
It is possible to arrange the 27 cards into a 3-by-3-by-3 cube arrangement, with the one green oval card in the very middle, and have every line through it yield a set:
Every one of the 13 sets is there, through the G1O card.
But I happened to notice that this arrangement also yielded all sorts of other sets not involving the G1O card. Every horizontal line, every vertical line, and every diagonal line is a set. In fact, if you took off the lower level of the cube and moved it on top of the upper level, every horizontal, vertical, and diagonal (following tic-tac-toe rules) line would be a set. And this also holds true if you took off the left face of the cube and moved it to the right of the right face. And so on. In fact, if this cube is tessellated by translation to fill up a 3-dimensional space, every horizontal, vertical, and diagonal line in that whole space will be a set! (This took quite a while to corroborate, but I am 99% sure I did not make any mistakes when I checked this.)
Every line in the space is a set. So does that mean the space contains ALL possible sets? How many sets are possible in the deck? That is easy: 27 cards to pick as initial seed times 13 sets with each card divided by 3 because each unique set is counted three times (once per each one of its cards as the initial seed). There are therefore 117 sets. How many lines in the space? This was a lot harder to figure out. Here are possible orientations of the lines:
- Left-Right (x-component only)
- Front-Back (y-component only)
- Top-Down (z-component only)
- FL-BR (no z-component)
- FR-BL (no z-component)
- TL-DR (no y-component)
- TR-DL (no y-component)
- TF-DB (no x-component)
- TB-DF (no x-component)
- TFL-DBR
- TFR-DBL
- TBL-DFR
- TBR-DFL
(The diagonal lines have to follow tic-tac-toe rules.) For each orientation of line, there are nine possible parallel lines. I tried to come up with a neat visual of this, but it is really hard to do. Anyway, 9 x 13 = 117 lines in the set. Yes, I think the space contains all possible sets.
What about the regular Set game and a 4-dimensional space?
Saturday, February 22, 2014
Log, log, it's big, it's heavy, it's wood
Every time I go for a jog, the first mile takes me 10 minutes. The second miles takes me 20 minutes. The third mile takes me 40 minutes. The next mile, of course, takes me 80 minutes. How long does it take me to finish my 10 mile jog? I think this "logarithmic jogging" fad is so silly...
That's why I got into "root jogging" instead! The first mile takes 10 minutes. The second mile takes 30 minutes. The third mile takes 50 minutes. The fourth miles takes 70 minutes... yet I finish my 10 mile jog so much faster!
How many intersections are there between and ? A lot of students would look at this graph

and say "one." Just like the logarithmic vs. root jogging, students notice the initial growth rate but fail to continue the pattern. Doubling the time to jog each mile will make jogging the fifth mile much slower under logarithmic jogging (160 minutes) compared to root jogging (90 minutes). Come to think of it, how many will recognize the question is exactly the same as this: How many intersections between and ?

On the other hand, it is easier to internalize and understand that exponential growth is insanely fast than it is to internalize that logarithmic growth is insanely slow.
To be fair, how logarithms work is pretty confusing. John Napier's purpose in developing logarithms was to simplify complicated multiplications, specifically, multiplications of long trigonometric decimals, such as sin(1)*cos(1). Before calculators, this kind of multiplication would be quite tedious. But logarithms turn multiplication into addition, so log[sin(1)*cos(1)] = log[sin(1)] + log[cos(1)]. All one needs to do is look up the logarithms of the two numbers in a table, add them together (much faster than multiplication), and then look up the inverse logarithm in a table.
The identity that logarithms turn multiplication into addition is quite mind-bending. Here is one way to demonstrate this fact: On a logarithm graph, a horizontal compression is the same thing as a positive vertical translation.

(Download the GeoGebra file here.)
In a pre-calculus class, I would want to establish that ln(x) is in in between reciprocal functions and root functions by graphing all three types, such as , g(x)=ln(x), and

The root function (in blue) grows without limit but has a finite value at x = 0. The ln(x) (in green) grows without limit but goes to negative infinity as x goes to 0. The reciprocal function (in red) grows to a horizontal asymptote and also goes to negative infinity as x goes to 0. Any reciprocal function has some horizontal asymptote. The ln(x) grows as slowly as possible without having an horizontal asymptote.
In a calculus class, once the students have seen l'Hopital's rule, they can prove that ln(x) fits in between these two types of functions. Both the reciprocal and root functions are of the form . Here is the short version:
So y=ln(x).
For the same reason, one can show this:

One final thought about logs. In a B.C. Calculus course, I ask my students to look at the Taylor series for the reciprocal, logarithmic, and root functions I mentioned above. The Taylor series are:
As you can see, the ln(x) fits right in between the other two.
One final thought on ln(x): a really neat property about its radius of convergence.
That's why I got into "root jogging" instead! The first mile takes 10 minutes. The second mile takes 30 minutes. The third mile takes 50 minutes. The fourth miles takes 70 minutes... yet I finish my 10 mile jog so much faster!
How many intersections are there between and ? A lot of students would look at this graph
and say "one." Just like the logarithmic vs. root jogging, students notice the initial growth rate but fail to continue the pattern. Doubling the time to jog each mile will make jogging the fifth mile much slower under logarithmic jogging (160 minutes) compared to root jogging (90 minutes). Come to think of it, how many will recognize the question is exactly the same as this: How many intersections between and ?
On the other hand, it is easier to internalize and understand that exponential growth is insanely fast than it is to internalize that logarithmic growth is insanely slow.
To be fair, how logarithms work is pretty confusing. John Napier's purpose in developing logarithms was to simplify complicated multiplications, specifically, multiplications of long trigonometric decimals, such as sin(1)*cos(1). Before calculators, this kind of multiplication would be quite tedious. But logarithms turn multiplication into addition, so log[sin(1)*cos(1)] = log[sin(1)] + log[cos(1)]. All one needs to do is look up the logarithms of the two numbers in a table, add them together (much faster than multiplication), and then look up the inverse logarithm in a table.
The identity that logarithms turn multiplication into addition is quite mind-bending. Here is one way to demonstrate this fact: On a logarithm graph, a horizontal compression is the same thing as a positive vertical translation.
(Download the GeoGebra file here.)
In a pre-calculus class, I would want to establish that ln(x) is in in between reciprocal functions and root functions by graphing all three types, such as , g(x)=ln(x), and
The root function (in blue) grows without limit but has a finite value at x = 0. The ln(x) (in green) grows without limit but goes to negative infinity as x goes to 0. The reciprocal function (in red) grows to a horizontal asymptote and also goes to negative infinity as x goes to 0. Any reciprocal function has some horizontal asymptote. The ln(x) grows as slowly as possible without having an horizontal asymptote.
In a calculus class, once the students have seen l'Hopital's rule, they can prove that ln(x) fits in between these two types of functions. Both the reciprocal and root functions are of the form . Here is the short version:
So y=ln(x).
For the same reason, one can show this:
One final thought about logs. In a B.C. Calculus course, I ask my students to look at the Taylor series for the reciprocal, logarithmic, and root functions I mentioned above. The Taylor series are:
As you can see, the ln(x) fits right in between the other two.
One final thought on ln(x): a really neat property about its radius of convergence.
Tuesday, December 10, 2013
Reading mathematics
I know students do not read mathematics textbooks, or if they try, they are usually confused. Part of the reason is that most textbooks are too wordy. Students struggle with the sentence length and the density of words on the page.
Part of the reason is that most textbooks tend to get too technical too fast. Unusual words, coupled with odd sentence structures ("Given that...," "it follows that..."), give students trouble.
Students bear some of the blame, because they think math can be read empty-handed and passively. "No," I exclaim, "You must have a pencil and paper out and work the examples as you read! No one can read passively and just absorb it."
These are known flaws.
But the main problem is that most textbooks do not have a good narrative structure to the lesson. By narrative structure, I do not mean personable characters or real-world inspired problems. I mean that the problems unfold in a good, compelling psychological order. A lesson should be almost like a puzzle in a murder mystery; each step provides another clue, the solution seems nearly in reach, and most important, what we want to solve is always clear (there is a known murder victim and a limited cast of suspects). A good lesson presents step-by-step clues to solve a straightforward but unknown problem.
A good lesson must be psychologically compelling, not logically ordered. For example, it makes sense to introduce definition at the end, once students have wrestled with examples and have an intuition about what counts and what does not and why. This is the best psychological order but backwards from logical order.
In a way, step-by-step clues is like reading a multi-layer G.I.S. map. If all the layers are visible at once, the map is overwhelming and incomprehensible. Instead, a good lesson shows students one layer of information at a time. "Look at this. Notice __ . Now look at this. How are these related?" The connections between different layers is how new knowledge is built -- this is all-important work. And the students must do the thinking on their own to make the deep connections. Yet a good lesson does not simply dump all the layers of information on them at once, and the sequence with which layers of information are revealed is critically important to making the lesson work.
Another key to a good textbook lesson is recognizing that students will quickly develop heuristics -- some good, some bad. The bad ones are over-simplifications that under-appreciate the complexity of a concept. The good ones reflect an idea accurately. (On a related note, I think a concept is about replacing specific details with key terminology or new ideas. A concept is like an svg, as opposed to a bitmap. A bitmap is dumb; an svg requires more "software" to understand -- but a lot more information can be compressed.) Anyway, the point is that a good lesson anticipates and immediately confronts and confounds bad heuristics.
My ideal textbook would look like what is below: straightforward questions, unfolding complexity, a goal in mind from the beginning, and -- best of all -- students are required to actively participate.
This seems a lot better than most textbooks at introducing a concept!
Friday, November 1, 2013
Metaphors, misconceptions, and doing mathematics
In our brains, there are some hardwired, a priori ideas. For lack of a better word, they are innate. Built-in. I've been reading Where Mathematics Comes From, by George Lakoff (yes, the Lakoff who analyzes political metaphors), and they try to root out some of the basic images, ideas, or metaphors that we layer upon to build mathematical thinking. I have not finished reading the book, but there is obviously a qualitative shift that happens for every student from innate to learned. While greater than-less than is probably an innate idea when we talk about the size of physical objects, all the ideas about greater than-less than with numbers or variables is learned. Clearly, the ideas about comparing the size of numbers or variables layer upon the innate understanding -- at first we reason by analogy to physical size, i.e., a group of six things is bigger than a group of four things. If, by chance, we met someone who could not grasp the idea of comparing physical sizes, we would think it quite odd and have a hard time helping them learn math. Yet despite the fundamental nature of the innate ideas, we know that most ideas in mathematics have to be learned. Plato gets himself into phenomenal trouble (pun deeply intended) by thinking that all mathematical ideas are a priori -- essentially, memories -- and not learned.
What is a mathematical concept or idea? It is actually really just a set of relationships (built up from some very basic, innate idea, perhaps). For example, "equilateral triangle" is a set of relationships: what a side is, what a polygon is, what equal lengths are -- and that is just the definition. Then all sorts of other properties get tied in: that its angles are equal, how to find the length of its altitude, how to find its area, that its altitude is its median is its angle bisector, that all the properties true for isosceles triangles are also true for equilateral triangles, the relationship of its inscribed circle's area to its circumscribing circle's area, how to tessellate it, etc., etc. To take another dig at Plato, he might say that this complexity shows equilateral triangles are the basis of all reality! (Yes, he really thought this.) Sorry, Plato, a lot of concepts are this interconnected.
What goes wrong when a student does not understand a concept?
One particular example of overgeneralizing that drives me nuts: CPCTC. For those who are not geometry teachers, this means "corresponding parts of congruent triangles are congruent." A rather obvious property, once you think about it, which should not really merit a name. Yet students overapply this like crazy. At one point, I had to scold my students: "CPCTC is not magic pixie-dust that you sprinkle on your work whenever you hope a miracle will happen!"
We teachers can feed into this, of course, by overgeneralizing. My worst example is the prohibition against side-side-angle congruence. We tell students it does not work, but that is an overgeneralization. Side-side-angle WILL work if the angle given is right or obtuse. And it even works for acute angles if the opposite side is longer than or equal to the adjacent side. It really only fails to prove congruence in one instance: given an acute angle and the adjacent side longer than the opposite side. So why do we tell our students to avoid this method of proving congruence? It actually makes a fun problem to foray into. Here is a fun little GeoGebra to begin exploring the ideas.
Aside from failure (1), the others are accurately called "misconceptions." The students think they have the idea, which makes it especially challenging to correct. I am going to quote Shawn Cornally at length here about how to root out misconceptions:
Ben Orlin has a great post where he compares doing mathematics to rock-climbing. It is worth reading in its entirety, but here is the part that struck me.
This strikes me as just right. Mathematics is supposed to be elegant, flexible, graceful, and subtle. The attitude of a student who does math "like a man" is abetted by a curriculum that allows that approach to be somewhat successful. I think a good curriculum ought to convince students fairly quickly that this is a dead-end approach; I have written about it here, here, and here. To summarize, a student who does math "like a man" probably never had a teacher "tee up" to a misconception.
One last thought: I have a meta-study guide I give my students at several points during the year. I want to emphasize to them that studying -- good, effective studying -- is about thinking conceptually, rooting out misconceptions, and working to understand things. My guide gives them some concrete suggestions to do so on their own.
What is a mathematical concept or idea? It is actually really just a set of relationships (built up from some very basic, innate idea, perhaps). For example, "equilateral triangle" is a set of relationships: what a side is, what a polygon is, what equal lengths are -- and that is just the definition. Then all sorts of other properties get tied in: that its angles are equal, how to find the length of its altitude, how to find its area, that its altitude is its median is its angle bisector, that all the properties true for isosceles triangles are also true for equilateral triangles, the relationship of its inscribed circle's area to its circumscribing circle's area, how to tessellate it, etc., etc. To take another dig at Plato, he might say that this complexity shows equilateral triangles are the basis of all reality! (Yes, he really thought this.) Sorry, Plato, a lot of concepts are this interconnected.
What goes wrong when a student does not understand a concept?
- Failure of imagination: They are having trouble understanding the basic idea, connecting it or analogizing it to innate ideas and/or ideas they already understand.
- Failure of wrong picture: They think they have the right picture, but the analogy is wrong.
- Failure of oversimplified heuristic: The basic idea is right, but the student has a shortcut that is insufficiently complex to solve problems. In other words, the foundational understanding is there, but the mathematical thinking that has been layered on top is sketchy.
- Failure of overgeneralizing: They understand an idea and know the mathematical strategies, too, but they apply this idea inappropriately. Connections to other ideas are supposed to enrich an idea AND LIMIT it. For example, students should use isosceles triangle properties on equilateral triangles -- but not in the other direction! Yet many see the ideas map in one direction, and assume both directions of idea-mapping are acceptable.
One particular example of overgeneralizing that drives me nuts: CPCTC. For those who are not geometry teachers, this means "corresponding parts of congruent triangles are congruent." A rather obvious property, once you think about it, which should not really merit a name. Yet students overapply this like crazy. At one point, I had to scold my students: "CPCTC is not magic pixie-dust that you sprinkle on your work whenever you hope a miracle will happen!"
We teachers can feed into this, of course, by overgeneralizing. My worst example is the prohibition against side-side-angle congruence. We tell students it does not work, but that is an overgeneralization. Side-side-angle WILL work if the angle given is right or obtuse. And it even works for acute angles if the opposite side is longer than or equal to the adjacent side. It really only fails to prove congruence in one instance: given an acute angle and the adjacent side longer than the opposite side. So why do we tell our students to avoid this method of proving congruence? It actually makes a fun problem to foray into. Here is a fun little GeoGebra to begin exploring the ideas.
Aside from failure (1), the others are accurately called "misconceptions." The students think they have the idea, which makes it especially challenging to correct. I am going to quote Shawn Cornally at length here about how to root out misconceptions:
- You have to tee up the misconceptions. This does not look like simply saying the misconception followed by the “correct” model. This does look like getting the students to display their dizzying array of pre(mis)conceptions. Use whiteboards, video tape each other and compile it, and come to a consensus–even if it’s the wrong consensus.
- You have to provide an experience that frustrates and confuses. This is based on some awesome neuroscience; basically, the human brain is not like a computer file system. When you edit the file on a computer, the magnetic dipole or electronic domain are flipped with an application of current. Human memories are repetitive, sensory-correlated, and plastic. You have to have the file open, and you have to chisel at it repetitively from different angles, and the misconceptions will often spend some time living in bizarre discord with the more appropriate model. This is ok, if not somewhat drawn out.
- You have to measure the extensibility of the new model. Can the student take the new model on the road? Is their understanding of rates limited to iterations of meters and seconds, or can they take that and apply it to dollars per volume? Have you measured their abstraction level?
* * *
Ben Orlin has a great post where he compares doing mathematics to rock-climbing. It is worth reading in its entirety, but here is the part that struck me.
Too many students think math ability lies along a single axis. But soon they discover the sprawling taxonomy of mathematical skills. There’s speed--in computing, in connecting, in spotting errors. There’s organization--of arithmetic, of arguments, of ideas. There’s understanding--of concepts, of technicalities, of deep truths. And so on. When you’re doing math, you’re not just a single mechanism. You’re a whole brain...
Lots of students try to do math like a man. They stare intently at an example, and then tackle a practice problem, diligently striving to reproduce the method step for step. Sweat gathers on their brow. It’s a draining, painful process, and not at all how math is meant to be done. Like rock-climbing, math rewards the nimble. People who employ their full toolbox fare better than ones who rely exclusively on memorization and formalisms.
This strikes me as just right. Mathematics is supposed to be elegant, flexible, graceful, and subtle. The attitude of a student who does math "like a man" is abetted by a curriculum that allows that approach to be somewhat successful. I think a good curriculum ought to convince students fairly quickly that this is a dead-end approach; I have written about it here, here, and here. To summarize, a student who does math "like a man" probably never had a teacher "tee up" to a misconception.
One last thought: I have a meta-study guide I give my students at several points during the year. I want to emphasize to them that studying -- good, effective studying -- is about thinking conceptually, rooting out misconceptions, and working to understand things. My guide gives them some concrete suggestions to do so on their own.
Subscribe to:
Posts (Atom)