To me, the best rebuttal to Dr. Pinker's theory would be this: If there is a connection between geography and culture, surely it must be about the urban-rural split. If I am the sort of person who likes independence, self-reliance, and all that, then I would be more likely to choose to live in a rural area. If I am the sort of person who likes (or doesn't mind) a more active and visible government, then I would be more likely to choose to live in an urban area. Everything Dr. Pinker said about herding cultures makes a lot more sense (to me) as a description of rural communities than as a description of Southern ones per se. Take a look at this map from the NY Times from the 2008 election, if you don't believe me:

Can you tell which counties have major urban areas in the South? Can you tell which counties are rural in California, Oregon, and Washington? Even Pennsylvania and New York have large dollops of red. It isn't perfect, but it's a clear pattern. Perhaps cultural differences are more about how rural a county is, and it happens that the South and plains states have more rural counties.
I was interested in how good a pattern it was, so I pulled data from the Census Bureau on the 2010 county-level data and the 2008 elections. One question is what measure of density to use. I settled on using weighted population density (or perceived density), since it's relatively easy to calculate from the census-tract-level data. If you care to, you can download the full spreadsheet of all weighted population densities for every U.S. county for 2010, along with the 2008 county-level election results (excepting Alaska), or just scroll through it below:
The weighted population densities accord with my perception of the densest counties fairly well (in people/square mile):

The densest counties are around New York, San Francisco, Boston, Philadelphia, Baltimore/D.C., Chicago, Honolulu, and Miami. On the other end:

The least dense counties are in the mountains, desert, and Alaska. Now, a caution with weighted population density is that the geographic size of the county and its total population are not relevant. What matters is how densely the people who live in a county are clustered. Hot Springs County, WY is a good example: enormous area, small population of 5,000 people, but a weighted density of 888 people/sq. mile because everyone is clustered in Thermopolis. This puts it at a weighted density similar to Horry County, SC (894 people/sq. mile), the home of Myrtle Beach and about 270,000 people.
For further proof of the legitimacy of weighted population density, I offer this comparison of the density at a state level versus the Census Bureau's calculation of percent of state population that resides in urban areas:

The one highlighted point, New York state, is an outlier because of the extreme density of Manhattan and the rest of New York City. When New York state is taken out, the coefficient of determination increases to 0.86.
So with the question of the measure of density settled, how good is the correlation between density (urban vs. rural) and voting ideology (excluding Alaska)? Not shabby:
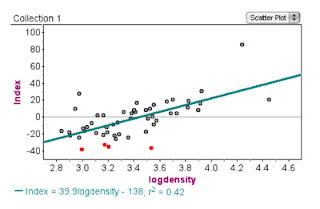
The log of density of the whole state is the explanatory variable and an index of political leaning, based on registrations and voting patterns (from fivethirtyeight), the response variable. The four underperformers highlighted in red are, from left to right, Wyoming, Idaho, Oklahoma, and Utah. Wyoming, Idaho, and Utah are the three states with the highest Mormon percentage. Oklahoma is the state with the highest evangelical percentage. Again, I think urbanism (along with other factors such as religion) is a solid explanatory variable. And to make the argument that urbanism should dislodge "unique culture" as the preferred explanation:

The vertical axis displays the average percent vote for Obama in the counties in each category. The horizontal axis displays the counties in 8 categories of density, from most dense on the left to least on the right. The counties listed are an average density county from that category. New York City is the only city in the most dense category. The second category contains most of the superdense urban cores of other major urban areas. The third category includes lots of medium-density cities like Portland, OR. The fourth category is suburban and micropolitan areas, and the last three categories are various degrees of rural. The regions are straightforward: east coast (New England, RI, CT, NY, NJ, Pennsylvania, MD), midwest (Great Lakes, Iowa), south (including WV, VA, AK, TX), plains (MO, OK, KS, NE, SD, ND), mountains (NM, AZ, NV, CO, UT, WY, ID, MT), and the west (CA, OR, WA, HI).
As you can see, the pattern is stark: from a high of over 80% voting for Obama, straight down to 20% and below in the most rural counties. While there are differences between regions, these are clearly overwhelmed by the overall pattern: urbanity matters much more than region. Now I must note that while the averages show a clear pattern, there is enormous variability -- the standard deviations are 6 to 12 percentage points for each category/region. The overall correlation between log(density) and voting is only r^2 = 0.16. So other factors are important, too. But this analysis rules out regional differences as a major one to me.
Here's a whole bunch of articles on the importance of urbanity: article , article , article, article, article, article.
But the best confirmation is the results of this Pew survey I read about:
Consistently liberal Americans want to live in walkable communities with smaller homes by a huge 77-21 margin, while three-quarters of consistently conservative Americans would rather live in communities with larger homes, but where schools and other amenities are miles away. Just 4 percent of consistent conservatives say they’d prefer to live in a city, compared with 46 percent of consistent liberals.
That about says it all. Here's an update from the 2016 election. Even more granular data shows the same patterns in small towns.
No comments:
Post a Comment