Every debater knows the predicted number of teams with each record when power-matching is used:
and so on. But how would it work without power-matching? What if teams were paired at random? The easy part is using the laws of probability to figure out which matches happen by chance. That's listed in column F.
The hard part is figuring out which team wins. If both teams have the same record, then whichever team wins, the outcome is the same. For example, in round two, the 25 teams in 1-0 vs. 1-0 rounds (ignore the fact that this is odd--it makes no difference in the end) and the 25 teams in 0-1 vs. 0-1 rounds guarantees that 12.5 teams will have a 2-0 record; 25 will be 1-1; and 12.5 will be 0-2. These guaranteed outcomes are listed in column I.
But what happens if the two teams have different records? One possibility is that there are no upsets at all. For example, in round two, of the 50 teams in 1-0 vs. 0-1 rounds, exactly half are 1-0s. These 25 teams might all win--no upsets--and become 2-0s. The 25 teams that are 0-1s all become 0-2s. These no-upset results are listed in column J.
The other possibility is that all rounds with mixed records have upsets. In round two, of the 50 teams with 1-0 vs. 0-1 rounds, the 25 teams that are 0-1s could all win, becoming 1-1s, while the 25 teams with 1-0s all lose, become 1-1s. Thus all 50 teams end up 1-1. These all-upset results are listed in column K.
Of course, neither no-upsets or all-upsets is realistic. From other research I've done, it turns out the upset rate is more like 20%, so I blended the two results 80:20 no-upsets:all-upsets in column L. As you can see, the ultimate outcome is that each record is nearly balanced with the others, though slightly more in the mediocre results. For example, after three rounds, a 20% upset rate results in about 17 teams that are 4-0s; 22 teams that are 3-1s; 23 teams that are 2-2s; etc.
Yet the 20% upset rate is probably conservative. It is unlikely that an 0-3 team has a 20% chance against a 3-0 team. As the teams are farther apart in record in later rounds, the overall upset rate must drop. If this is so, the final outcomes flatten. It turns out that if the upset rate is 1/6 for round two, drops to 1/8 for round three, and further drops to 1/10 for round four, then the final outcome is that exactly 20 teams are 4-0s; 20 are 3-1s; etc.
What happens if teams are paired at random? It depends on the upset rate. If it's exactly 50% (which is far too high), then the final outcomes look exactly like it would with power-matching:
If the upset rate is a more realistic, empirically justified 20%, then the outcomes are much flattened and nearly equally distributed:
Here's the sheet for anyone who'd like to play around with it.
Essays on education, debate, and math instruction; neat math problems; and whatever else I get around to.
Showing posts with label power-matching. Show all posts
Friday, July 27, 2018
Saturday, July 4, 2015
Study of speaker points and power-matching for 2006-7
For my 100th blog post, I did an experiment to try different tabulation methods for debate tournaments. The benefit of an experiment is that the exact strength of each team is known and the simulated tournaments introduced random deviation on performance in each round. The deviation in performance is based on observed results.
The results of the experiment showed that, even after only six rounds, median speaker points is a more accurate measure of a team's true strength than its win-loss record. Furthermore, the results showed that high-low power-matching improved the accuracy of the win-loss record as a measure of strength (but only to the same level of accuracy as median speaker points) and high-high power-matching worsened its accuracy.
This experiment lead me to do an observational study of the 2006-07 college cross-examination debate season. I analyzed all the varsity, preliminary rounds listed on debateresults.com: 7,923 rounds; 730 teams. This was the last year when every tournament used the traditional 30-point speaker point scale. Each team was assigned a speaker point rank from 1 (best) to 730 based on its average speaker points. Each team was also assigned a win-loss record rank from 1 to 730 based on the binomial probability of achieving its particular number of wins and losses by chance. Thus, both teams that had extensive, mediocre records AND teams with few total rounds ended up in the middle of the win ranks.
Next, I analyzed every individual round using the two opponents' point ranks and win ranks. For example, if one team had a good point rank and one a bad point rank, then of course the odds are quite high the good team would win. On the other hand, if the two teams were similarly ranked, then the odds are much closer to even. Using the point ranks, I did a logit regression to model the odds for different match-ups. And I also ran a separate logit regression for win ranks. Here are the regressions:
The horizontal axis shows the difference in the ranks between the two opponents. The vertical axis shows the probability of the Affirmative winning. For example, when Affirmative teams were 400 ranks better (smaller number) than its opponent, they won about 90% of those rounds. These odds are based on the actual outcomes observed in the 2006-07 college debate season.
The belief in the debate community is that speaker points were too subjective -- in the very next season, the format of speaker points was tinkered with and changed. The community settled on adjusting speaker points for judge variability, that is using "second order z-scores." Yet my analysis shows that, over the entire season, the average speaker points of a team is a remarkably good measure of its true strength. Making a lot of adjustments to the speaker points is unnecessary.
First, note how similar the two logistic regressions are. A difference of 100 win ranks, say, is as meaningful for predicting the actual outcomes as a difference of 100 point ranks. Using the point ranks regression "predicts" 75% of rounds correctly, while using the win ranks regression "predicts" 76% correctly. Both regressions "predict" each team's win-loss record with 91% accuracy. (This discrepancy between 75% and 91% occurs because, overall, many rounds are close and therefore difficult to predict -- but for an individual team that has eight close rounds, predicting a 4-4 record is likely to be very accurate.)
What is impressive to me is that, even without correcting for judge bias, the two methods are very comparable. Bear in mind it is NOT because every team receives identical win ranks and point ranks. In fact, as you will see in the next section, some teams got quite different ranks from points and from wins!
In the second part of my analysis, I looked at how power-matching influenced the results. I could not separate out how each round was power-matched because that information was not available through debateresults.com. But college debate rounds tend to be power-matched high-low, which is better than power-matching high-high (as my experiment showed). I eliminated teams with fewer than 12 rounds because they have such erratic results. This left 390 teams for the second analysis.
The goal of power-matching is to give good teams harder schedules and bad teams weaker schedules. Does it succeed at this goal?
No:
I made pairwise comparisons between the best and second-best team, the second- and third-best team, and so on. It is common for two teams with nearly identical ranks to have very different schedules. The average difference in schedule strength is 68 ranks apart out of only 730 ranks, which is almost a tenth of the field! One team may face a schedule strength at the 50th percentile, while a nearly identical team faces a schedule strength at the 60th percentile. Bear in mind that this is the average; in some cases, two nearly identical teams faced schedule strengths 30 percentiles apart! I cannot think of clearer evidence that power-matching fails at its assigned goal.
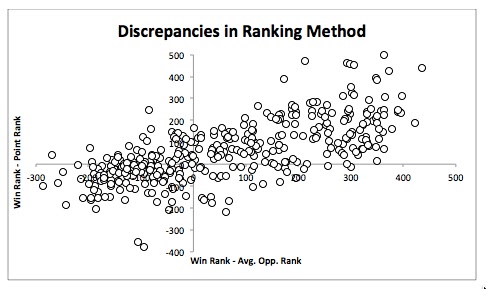
Finally, I performed a regression to see whether these differing schedule strengths is the cause of the discrepancy between win ranks and point ranks.
Yes:
The horizontal axis shows the difference between each team's rank and its schedule strength. The zero represents teams that have ranks equal to schedule strength. The vertical axis shows the difference between each team's win rank and point rank.
Teams in the upper right corner had easier schedules than they should have (under power-matched) and better win ranks than point ranks. Teams in the lower right corner had harder schedules than they should have (over power-matched) and had worse win ranks than point ranks. Having easy schedules improved win ranks; having hard schedules worsened win ranks. The effect is substantial: r^2 is 0.49. Of course, some of the discrepancy between the ranks is caused by other factors: random judging, teams that speak poorly but make good arguments, etc. But power-matching itself is the largest source of the discrepancy.
Given that the schedule strengths varied so much, this is a big, big problem. I know that tab methods have improved since 2006-7 and now factor in schedule strength; this analysis should be rerun on the current data set to see if the problem has been repaired.
One could argue for power-matching on educational grounds: it makes the tournament more educational for the competitors. However, it is clear from this analysis that power-matching is not necessary to figure out who the best teams are. In fact, it might actually be counterproductive. Using power-matched win-loss records takes out one source of variability from the ranking method -- judges who give inaccurate speaker points -- but adds an entirely new one: highly differing schedule strength!
The results of the experiment showed that, even after only six rounds, median speaker points is a more accurate measure of a team's true strength than its win-loss record. Furthermore, the results showed that high-low power-matching improved the accuracy of the win-loss record as a measure of strength (but only to the same level of accuracy as median speaker points) and high-high power-matching worsened its accuracy.
Description of the study
This experiment lead me to do an observational study of the 2006-07 college cross-examination debate season. I analyzed all the varsity, preliminary rounds listed on debateresults.com: 7,923 rounds; 730 teams. This was the last year when every tournament used the traditional 30-point speaker point scale. Each team was assigned a speaker point rank from 1 (best) to 730 based on its average speaker points. Each team was also assigned a win-loss record rank from 1 to 730 based on the binomial probability of achieving its particular number of wins and losses by chance. Thus, both teams that had extensive, mediocre records AND teams with few total rounds ended up in the middle of the win ranks.
Next, I analyzed every individual round using the two opponents' point ranks and win ranks. For example, if one team had a good point rank and one a bad point rank, then of course the odds are quite high the good team would win. On the other hand, if the two teams were similarly ranked, then the odds are much closer to even. Using the point ranks, I did a logit regression to model the odds for different match-ups. And I also ran a separate logit regression for win ranks. Here are the regressions:
The horizontal axis shows the difference in the ranks between the two opponents. The vertical axis shows the probability of the Affirmative winning. For example, when Affirmative teams were 400 ranks better (smaller number) than its opponent, they won about 90% of those rounds. These odds are based on the actual outcomes observed in the 2006-07 college debate season.
The belief in the debate community is that speaker points were too subjective -- in the very next season, the format of speaker points was tinkered with and changed. The community settled on adjusting speaker points for judge variability, that is using "second order z-scores." Yet my analysis shows that, over the entire season, the average speaker points of a team is a remarkably good measure of its true strength. Making a lot of adjustments to the speaker points is unnecessary.
First, note how similar the two logistic regressions are. A difference of 100 win ranks, say, is as meaningful for predicting the actual outcomes as a difference of 100 point ranks. Using the point ranks regression "predicts" 75% of rounds correctly, while using the win ranks regression "predicts" 76% correctly. Both regressions "predict" each team's win-loss record with 91% accuracy. (This discrepancy between 75% and 91% occurs because, overall, many rounds are close and therefore difficult to predict -- but for an individual team that has eight close rounds, predicting a 4-4 record is likely to be very accurate.)
What is impressive to me is that, even without correcting for judge bias, the two methods are very comparable. Bear in mind it is NOT because every team receives identical win ranks and point ranks. In fact, as you will see in the next section, some teams got quite different ranks from points and from wins!
Power-matching
In the second part of my analysis, I looked at how power-matching influenced the results. I could not separate out how each round was power-matched because that information was not available through debateresults.com. But college debate rounds tend to be power-matched high-low, which is better than power-matching high-high (as my experiment showed). I eliminated teams with fewer than 12 rounds because they have such erratic results. This left 390 teams for the second analysis.
The goal of power-matching is to give good teams harder schedules and bad teams weaker schedules. Does it succeed at this goal?
No:
I made pairwise comparisons between the best and second-best team, the second- and third-best team, and so on. It is common for two teams with nearly identical ranks to have very different schedules. The average difference in schedule strength is 68 ranks apart out of only 730 ranks, which is almost a tenth of the field! One team may face a schedule strength at the 50th percentile, while a nearly identical team faces a schedule strength at the 60th percentile. Bear in mind that this is the average; in some cases, two nearly identical teams faced schedule strengths 30 percentiles apart! I cannot think of clearer evidence that power-matching fails at its assigned goal.
Finally, I performed a regression to see whether these differing schedule strengths is the cause of the discrepancy between win ranks and point ranks.
Yes:
The horizontal axis shows the difference between each team's rank and its schedule strength. The zero represents teams that have ranks equal to schedule strength. The vertical axis shows the difference between each team's win rank and point rank.
Teams in the upper right corner had easier schedules than they should have (under power-matched) and better win ranks than point ranks. Teams in the lower right corner had harder schedules than they should have (over power-matched) and had worse win ranks than point ranks. Having easy schedules improved win ranks; having hard schedules worsened win ranks. The effect is substantial: r^2 is 0.49. Of course, some of the discrepancy between the ranks is caused by other factors: random judging, teams that speak poorly but make good arguments, etc. But power-matching itself is the largest source of the discrepancy.
Given that the schedule strengths varied so much, this is a big, big problem. I know that tab methods have improved since 2006-7 and now factor in schedule strength; this analysis should be rerun on the current data set to see if the problem has been repaired.
Conclusions
- Speaker points are just as accurate a measure of true team strength as win-loss record. This confirms the results of my experiment showing that power-matched win-loss record is at rough parity in accuracy to median speaker points.
- Power-matching as practiced in the 2006-07 college debate season does not give equal strength teams equal schedules. (This method is probably still in use in many high school tournaments.)
- Unequal schedule strengths are highly correlated with discrepancies in the two ranking methods, point ranks and win ranks.
One could argue for power-matching on educational grounds: it makes the tournament more educational for the competitors. However, it is clear from this analysis that power-matching is not necessary to figure out who the best teams are. In fact, it might actually be counterproductive. Using power-matched win-loss records takes out one source of variability from the ranking method -- judges who give inaccurate speaker points -- but adds an entirely new one: highly differing schedule strength!
Labels:
debate tournaments,
power-matching,
speaker points
Friday, August 7, 2009
Another way to visualize strength-of-schedule pairings
I've written about a type of pairing I call a strength-of-schedule pairing. The basic idea is that a team that has had a weak schedule so far (measured by opp. wins, opp. speaks, etc.) gets a strong opponent for the next round. (Of course, all of this is within a bracket, so weak and strong are relative to the average team strength and schedule strength in that bracket.) It sounds simple enough, but it has to work both ways -- both teams get the opponent they deserve in each other.
It hit me how to help people visualize how this pairing method differs from the traditional. First, picture a Cartesian grid, depicting one bracket, like so:

A position along the x-axis shows a team's strength (say, speaker points) above or below the average, 0, of the bracket. (If it helps, you can think of these as standard deviations above or below the mean; or, you can think of these as speaker points above or below 28.) A position along the y-axis shows a difficulty of a team's schedule above or below the average. Quadrant I contains the good teams in the bracket that have had tough schedules; quadrant IV contains the good teams that have had easy schedules.
Ideally, you want debaters from quadrant I (strong teams, strong schedules) to face debaters from quadrant III (weak teams, weak schedules), debaters from quadrant II (weak teams, strong schedules) to face each other, and debaters from quadrant IV (strong teams, weak schedules) to face each other -- to even everything out. Let's look at how the two traditional methods fare. I generated 16 random points on the grid, and based on their scores, power-matched them using these two methods.
First, high-high-pairings:

The best team faces the second best; third, the fourth; on down to the second worst facing the worst. Two debates are matched between quadrants I and IV. These are unfair to quadrant I teams, who are good teams, with tough schedules, facing yet another good team. There are four debates between quadrant II and III. These are unfair to quadrant III teams, who are weak teams, with easy schedules, facing yet another weak team. I'd say there's really only one good match: the quadrant IV team to the other quadrant IV team. All in all, many of these debates are likely to exacerbate the range of schedule strength teams face. Score: 1/8.
Second, let's look at the high-low pairing method, using the same 16 points:

The best team debates the lowest, then the second best debates the second worst, and so on. This is not much of an improvement in terms of equalizing schedule strength. There are two debates between quadrant I to II -- unfair to quadrant II teams, weak teams, tough schedules, facing another good opponent. There are two debates between quadrant III and IV -- unfair to quadrant IV teams, good teams, easy schedules, facing another weak opponent. And there are two that are truly wretched: quadrant II (weak teams, tough schedules) to quadrant IV (strong teams, easy schedules) -- unfair to both quadrant II and IV teams!! There are really only two good matches, between quadrant I and III teams. Score: 2/8.
Here's what a strength-of-schedule pairing looks like, for the same points:

I didn't tweak it! This is what came out of my algorithm. All eight matches accord with the preferences I spelled out: Is debate IIIs, IIs debate IIs, and IVs debate IVs. I added in the dotted line to show that most of them have this rough symmetry, where the x score of one is nearly as possible -y of the other, and vice versa. Given the random distribution of the points, it's pretty darn good. All in all, this will equalize as much as possible the schedule strength faced by each team in this bracket. Tough schedule? Weak opponent. Easy schedule? Strong opponent. Score: 8/8.
It hit me how to help people visualize how this pairing method differs from the traditional. First, picture a Cartesian grid, depicting one bracket, like so:

A position along the x-axis shows a team's strength (say, speaker points) above or below the average, 0, of the bracket. (If it helps, you can think of these as standard deviations above or below the mean; or, you can think of these as speaker points above or below 28.) A position along the y-axis shows a difficulty of a team's schedule above or below the average. Quadrant I contains the good teams in the bracket that have had tough schedules; quadrant IV contains the good teams that have had easy schedules.
Ideally, you want debaters from quadrant I (strong teams, strong schedules) to face debaters from quadrant III (weak teams, weak schedules), debaters from quadrant II (weak teams, strong schedules) to face each other, and debaters from quadrant IV (strong teams, weak schedules) to face each other -- to even everything out. Let's look at how the two traditional methods fare. I generated 16 random points on the grid, and based on their scores, power-matched them using these two methods.
First, high-high-pairings:

The best team faces the second best; third, the fourth; on down to the second worst facing the worst. Two debates are matched between quadrants I and IV. These are unfair to quadrant I teams, who are good teams, with tough schedules, facing yet another good team. There are four debates between quadrant II and III. These are unfair to quadrant III teams, who are weak teams, with easy schedules, facing yet another weak team. I'd say there's really only one good match: the quadrant IV team to the other quadrant IV team. All in all, many of these debates are likely to exacerbate the range of schedule strength teams face. Score: 1/8.
Second, let's look at the high-low pairing method, using the same 16 points:

The best team debates the lowest, then the second best debates the second worst, and so on. This is not much of an improvement in terms of equalizing schedule strength. There are two debates between quadrant I to II -- unfair to quadrant II teams, weak teams, tough schedules, facing another good opponent. There are two debates between quadrant III and IV -- unfair to quadrant IV teams, good teams, easy schedules, facing another weak opponent. And there are two that are truly wretched: quadrant II (weak teams, tough schedules) to quadrant IV (strong teams, easy schedules) -- unfair to both quadrant II and IV teams!! There are really only two good matches, between quadrant I and III teams. Score: 2/8.
Here's what a strength-of-schedule pairing looks like, for the same points:

I didn't tweak it! This is what came out of my algorithm. All eight matches accord with the preferences I spelled out: Is debate IIIs, IIs debate IIs, and IVs debate IVs. I added in the dotted line to show that most of them have this rough symmetry, where the x score of one is nearly as possible -y of the other, and vice versa. Given the random distribution of the points, it's pretty darn good. All in all, this will equalize as much as possible the schedule strength faced by each team in this bracket. Tough schedule? Weak opponent. Easy schedule? Strong opponent. Score: 8/8.
Friday, March 6, 2009
What are normal opponents wins in a given bracket?
I decided to look at several big, well-run tournaments from this year and last year. I chose big tournaments because there's less of a chance that odd results were created by restrictions given small brackets with too many teams from the same schools. I'm not going to include the tournaments' names -- this is just data. Here are the results for teams that broke:
That means at one tournament, the 6-0 with the hardest schedule faced opponents accumulating 25 wins, while at the same tournament, the 6-0 with the easiest schedule faced opponents accumulating only 22 wins. For the most part, the 6-0s at all these tournaments had reasonably narrow ranges (meaning that all the 6-0s had roughly similar strengths of schedule) except at two tournaments: the 16-25 and 19-24 are unusually broad ranges. A result of 25 opponent wins averages out to a little better than a 4-2 record/opponent; 16 OW averages out to worse than a 3-3 record! The spread for 5-1s, however, looks consistently larger, from better than a 4-2 record/opponent average down to a worse than a 3-3 record/opponent average.
The results are even more surprising when looking at seven round divisions:
The 7-0s' ranges look reasonably small, but the 6-1s and 5-2s faced very different schedules of opponents! At one tournament, the luckiest 5-2 faced opponents racking up only 21 wins (an average of a 3-4 record), while another 5-2 faced opponents racking up a whopping 36 wins (an average of better than 5-2) -- a harder schedule than the best 7-0 faced!
That means at one tournament, the 6-0 with the hardest schedule faced opponents accumulating 25 wins, while at the same tournament, the 6-0 with the easiest schedule faced opponents accumulating only 22 wins. For the most part, the 6-0s at all these tournaments had reasonably narrow ranges (meaning that all the 6-0s had roughly similar strengths of schedule) except at two tournaments: the 16-25 and 19-24 are unusually broad ranges. A result of 25 opponent wins averages out to a little better than a 4-2 record/opponent; 16 OW averages out to worse than a 3-3 record! The spread for 5-1s, however, looks consistently larger, from better than a 4-2 record/opponent average down to a worse than a 3-3 record/opponent average.The results are even more surprising when looking at seven round divisions:
The 7-0s' ranges look reasonably small, but the 6-1s and 5-2s faced very different schedules of opponents! At one tournament, the luckiest 5-2 faced opponents racking up only 21 wins (an average of a 3-4 record), while another 5-2 faced opponents racking up a whopping 36 wins (an average of better than 5-2) -- a harder schedule than the best 7-0 faced!
Wednesday, March 4, 2009
A hypothetical worst case debate math scenario...
One other little bit of tournament math... Imagine this hypothetical team, call it team uno, the best team at a tournament, in a tournament using the traditional high-low power-matching system. First and second round are random, so it's possible team uno might hit the worst and second worst teams at the tournament in rounds 1 and 2. These two awful teams go on to a 0-6 win-loss record. Then, team uno, being 2-0 with the best speaker points, will hit the worst 2-0 with the lowest speaker points, which could conceivably lose all its remaining rounds and finish 2-4. The same for the next round, hitting the worst 3-0, which could finish 3-3, and all the way through. It is possible in this way for the top team to face six opponents with a combined record of only 14 wins in six rounds. This averages to just slightly better than a 2-4 record/opponent. (Of course, it will likely be better, but it could even be worse if there are an uneven number of teams in each bracket and the top team receives a "pull-up" and debates an opponent with a one-loss worse record in one or more "power-matched" round.) Now, I think the ideal is for the best team at the tournament to face excellent opponents (this is what power-matching systems, like the Swiss system, are supposed to do!) perhaps averaging 4-2 or 5-1 records, for combined opponent wins in the range of 24-30. A far cry from 14 -- which could easily results from pairings that the current algorithm does create and is powerless to flag or rectify.
Subscribe to:
Posts (Atom)